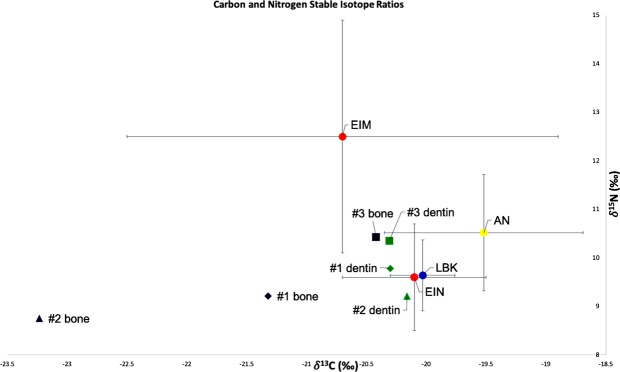
Figure 3.
Distribution of carbon and nitrogen isotope ratios of Individuals 1, 2 and 3 from Brunn am Gebirge site 2 in relation to the mean isotope ratios (±SD) from Anatolian Neolithic (AN), European Inland Mesolithic (EIM), European Inland Neolithic (EIN), and Linearbandkeramik (LBK) populations. Sources of the published data are given in Table 2. The figure and underlying statistical analyses were generated using Microsoft Excel 2019 for Mac, version 16.25.

