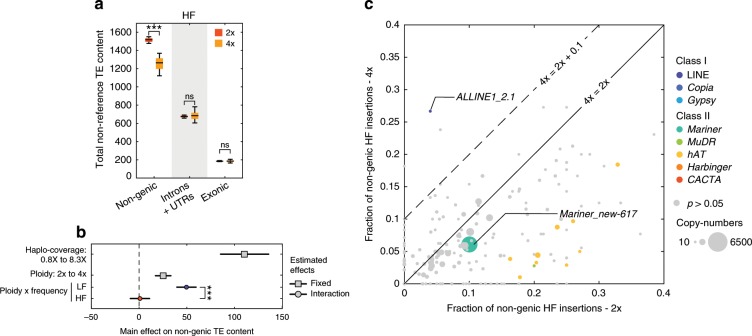
Fig. 3. Absence of genome-wide or family specific transposition burst hallmarks in autotetraploids.
a Number of TE insertions carried by 100 individuals by category (non-genic, introns and UTRs, exonic) in diploids and tetraploids at high-frequency (HF) with standard deviations across 100 random samples and p-value of t-test between ploidies. Boxplot center lines, median; box limits, upper and lower quartiles; whiskers, 9th and 91st quantiles. b Estimated MLM effects and interaction effects of haplo-coverage, ploidy, and insertion frequency on non-genic TE content. Horizontal lines indicate 95% confidence intervals for each effect value. p-values for each coefficient corresponds to the t-statistic of the hypothesis test that the corresponding coefficient is equal to zero or not. c Fraction of non-genic insertions at high-frequency (HF) in tetraploids versus diploids by TE family. TE families with χ2 p-values < 0.05 are colored. p < 0.001: ***; p < 0.01: **; p < 0.05: *; p ≥ 0.05: ns. The source data underlying Figs. 3a and 3c are provided as a Source Data file.

