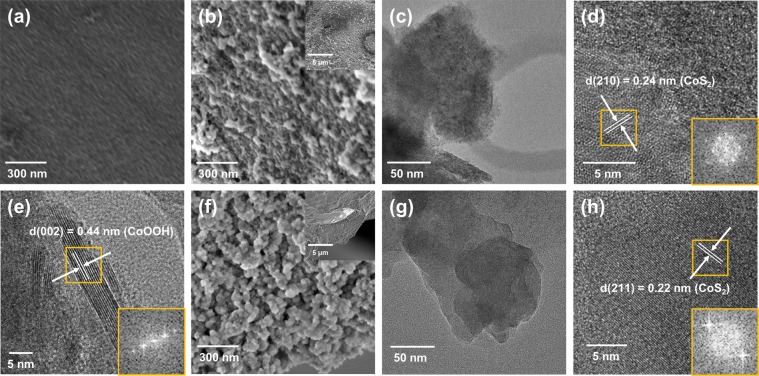
Figure 4.
Microstructural characterization of MOF-driven CoS2 electrode after durability test. (a) FE-SEM image of the bare Ni foam. (b–e) Electron microscopy images of MOF-driven CoS2 electrode after OER durability at 1.53 V (vs. RHE). (b) FE-SEM (inset: low magnification) (c) TEM, and (d,e) high-resolution TEM (inset: FFT analysis) images. (f,g) Electron microscopy images of MOF-driven CoS2 electrode after HER durability at −0.2 V (vs. RHE). (f) FE-SEM (inset: low magnification) (g) TEM, and (h) high-resolution TEM (inset: FFT analysis) images.

