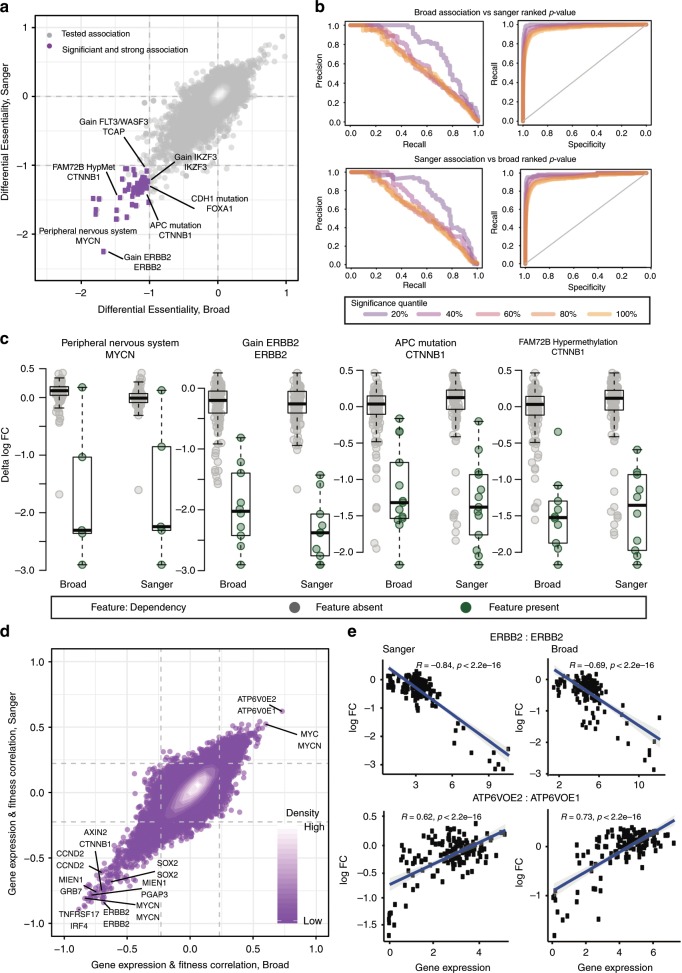
Fig. 3. Reproducibility of biomarkers.
a Results from a systematic association test between molecular features and differential gene dependencies (of the SSD genes) across the two studies. Each point represents a test for differential dependency on a given gene (on the second line of the point label) based on the status of a molecular feature (on the first line). b Precision/Recall and Recall/Specificity curves obtained when considering as positives controls the top significant molecular-feature/gene-dependency associations found in one of the studies and ranking all the tested molecular-feature/gene-dependency associations based on their p-values in the other study. To define top-significant associations different significance thresholds matching the quantile threshold specified in the legend are considered, where 100% includes all associations with FDR less than 5%. c Examples of significant statistical associations between genomic features and differential gene dependencies across the two studies. The box covers the interquartile range with the median line drawn within it. The whiskers of the boxplot extend to a maximum of 1.5 times the size of the interquartile range. d Comparison of results of a systematic correlation test between gene expression and dependency of SSD genes across the two studies. The gray dashed lines indicate the thresholds of significant correlations at a 5% false discovery rate identified for each study. Labeled points show the gene expression marker on the first line and gene dependency on the second line. Each tested association between gene expression and SSD dependency is represented by a single purple point. Regions with higher density of points are shown in white. e Examples of significant correlations between gene expression and dependencies consistently identified in both studies.

