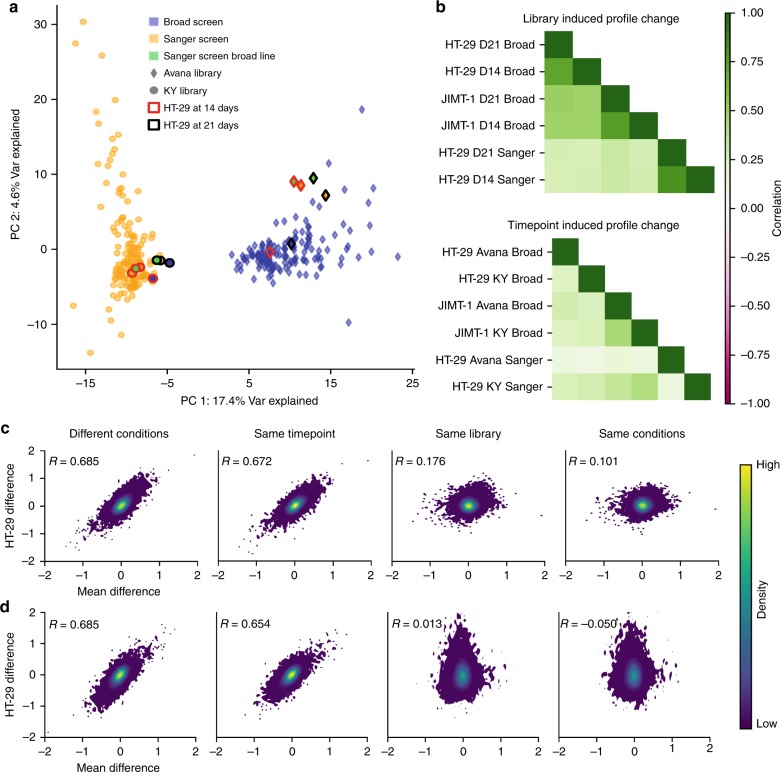
Fig. 6. Results of replication experiments.
a Original and replication screens from each institute plotted by their first two principal components. HT-29 screens are highlighted. Axes are scaled to the variance explained by each component. b Correlations of the changes in gene score caused when changing a single experimental condition. c The difference in unprocessed gene scores between Broad screens of HT-29 and the original Sanger screen (Sanger minus Broad), beginning with the Broad’s original screen and ending with the Broad’s screen using the KY library at the 14-day time point. Each point is a gene. The horizontal axis is the mean difference of the gene’s score between the Sanger and Broad original unprocessed data sets. d A similar plot taking the Broad’s original screen as the fixed reference and varying the Sanger experimental conditions (Broad minus Sanger).

