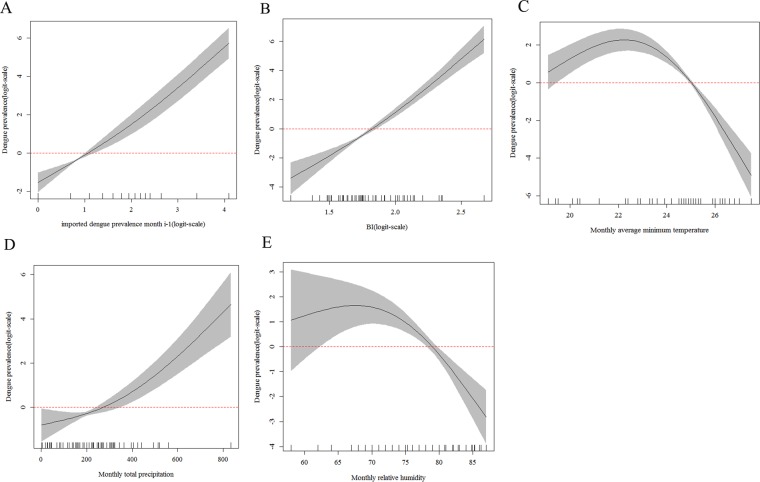
Figure 4.
Partial effects on the dengue prevalence (log scale) based on the monthly data from 2006 to 2017 in high-risk areas of Guangdong Province. (A) The effect of imported cases at last month. (B) The effect of BI. (C) The effect of the monthly average minimum temperature (°C). (D) The effect of the monthly total precipitation (mm). (E) The effect of monthly relative humidity. Black lines indicate the 95% confidence intervals and red dashed line showed the threshold.

