
Figure 2.
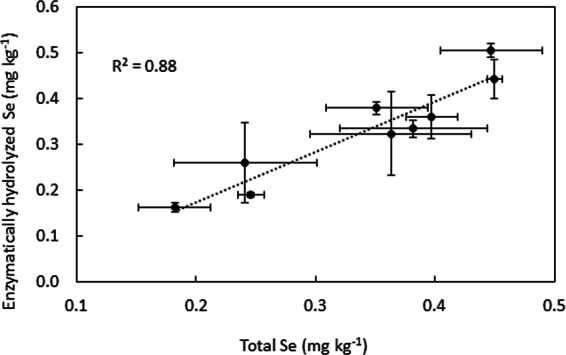
Correlation between total grain Se concentrations measured by two methods: acid digestion and enzymatic hydrolysis. Error bars represent standard errors (n = 4).
Official websites use .gov
A
.gov website belongs to an official
government organization in the United States.
Secure .gov websites use HTTPS
A lock (
) or https:// means you've safely
connected to the .gov website. Share sensitive
information only on official, secure websites.
Correlation between total grain Se concentrations measured by two methods: acid digestion and enzymatic hydrolysis. Error bars represent standard errors (n = 4).