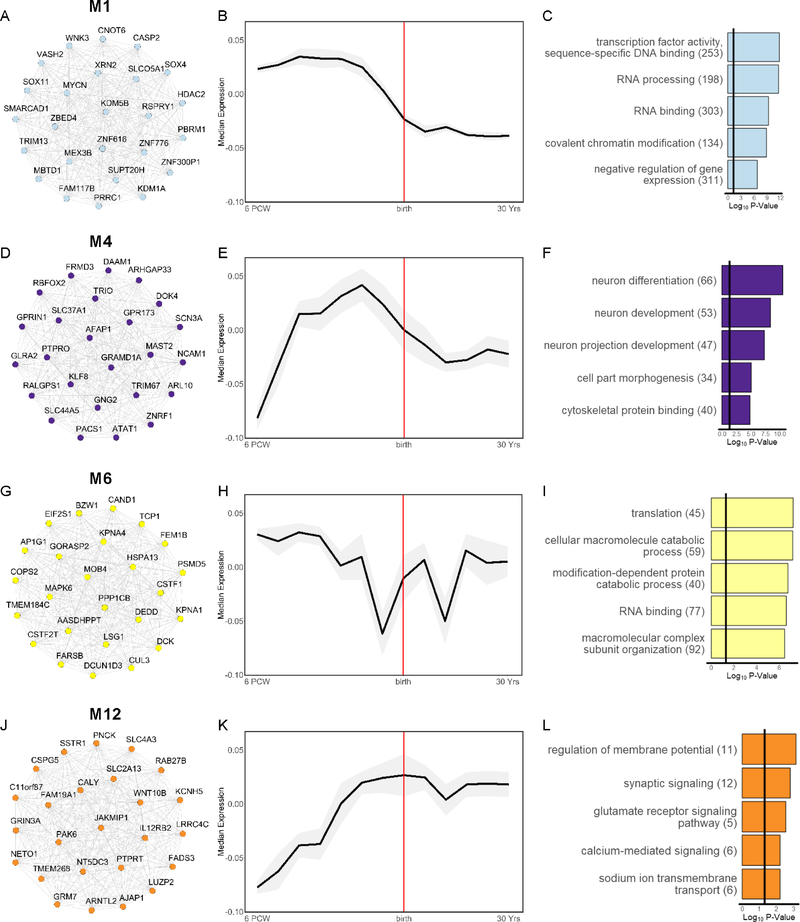
Figure 3. Characterization of BrainSpan Modules Associated Only with ASD.
Left: top 25 hub genes, Middle: developmental expression trajectory (median ± median absolute deviation of module eigengene in grey shading), and Right: top 5 significantly enriched biological process and molecular function gene ontology (GO) terms for the ASD-associated modules: (A-C) M1, (D-F) M4, (G-I) M6, and (J-L) M12. Hub genes and GO terms are colored by module. Edges between hub genes denote positive correlations between genes.

