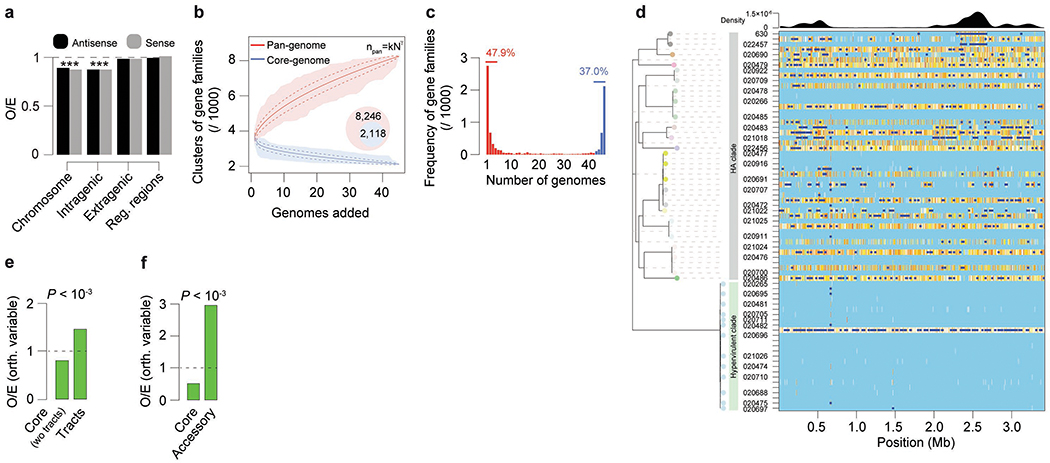
Extended Data Fig. 6. CAAAAA exceptionality, core- / pan-genome analyses of C. difficile, and homologous recombination (HR) landscape.
CAAAAA exceptionality, core- / pan-genome analyses of C. difficile, and homologous recombination (HR) landscape. (a) Observed (O) numbers of CAAAAA motifs in the C. difficile chromosome (n = 7,824), intragenic (n = 6,131), extragenic (n = 1,693), and regulatory regions (n = 794, defined as the windows spanning 100 bp upstream the start codon to 50 bp downstream) were compared with expected (E) values computed in random sequences showing the same oligonucleotide composition. The significance of the difference between O/E was evaluated by computing a P value based on a Gaussian approximation of motif counts under a Markov model of order 4 (*** P < 10−3). (b) Core- and pan-genome sizes of C. difficile. The pan- and core-genomes were used to perform gene accumulation curves. These curves describe the number of new genes (pan-genome) and genes in common (core-genome) obtained by adding a new genome to a previous set. The procedure was repeated 1,000 times by randomly modifying the order of integration of the n = 45 genomes in the analysis. Solid lines correspond to the average number of gene families obtained across all permutations, dashed lines indicate standard deviation of the mean, and shaded regions indicate range. The values for the specific constants obtained after Heap’s law fitting are 2,887 and 0.271, respectively for the k and γ, thus implying an open pan-genome. (c) Spectrum of frequencies for C. difficile gene repertoires. It represents the number of genomes where the families of the pan-genome can be found, from 1 for strain-specific genes to 45 for core-genes. Red indicates accessory genes and blue the genes that are highly persistent in C. difficile. (d) Graphical representation of the recombinational events in the core genome of C. difficile (inferred by ClonalFrameML). The HA and hypervirulent branches of the tree are depicted in colors. Substitutions are represented by vertical lines and recombination events by dark blue horizontal bars. Light blue vertical lines represent the absence of substitutions, and white lines refer to non-homoplasic substitutions. All other colors represent homoplasic substitutions, with increases in homoplasy associated with increases in the degree of redness (from white to red). (e) O/E ratios of orthologous variable CAAAAA motifs (compared to orthologous conserved) in the core-genome (excluding recombination tracts) (n = 770) and recombination tracts (n = 325), or (f) core (n = 1,095) and accessory genome (n = 1,415). P values correspond to the Chi-square test.

