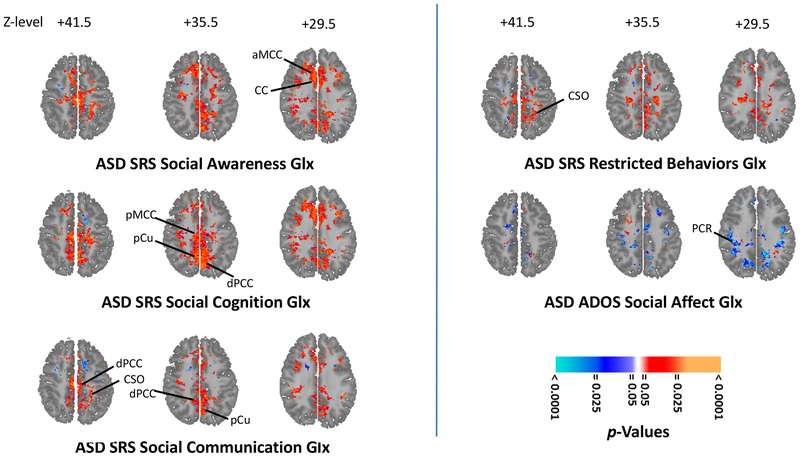
Figure 3.
Glutamatergic neuroanatomic profile of social symptoms in 62 participants with autistic spectrum disorder (ASD). Statistical parametric maps on selected axial brain sections show significance of correlations (orange-red for positive; cyan-blue for negative) of magnetic resonance spectroscopy levels of glutamate+glutamine (Glx) with scores on multiple subscales (left) of the Social Responsiveness Scale (SRS) reflecting different types of social symptoms in ASD. SRS Social Awareness symptoms (left upper) increase with increasing Glx in anterior middle cingulate cortex (aMCC) and corpus callosum (CC). SRS Social Cognition symptoms (left middle) increase with increasing Glx in posterior middle cingulate cortex (pMCC), precuneus (pCu), and dorsal posterior cingulate cortex (dPCC). SRS Social Communication symptoms (left lower) increase with increasing Glx in dPCC, centrum semiovale (CSO), and pCu. For comparison (right upper), correlations of (non-social) SRS Restricted Behaviors symptoms with Glx. For further comparison (right middle), correlations of Glx with social symptoms of yet another type, captured by a different instrument, the Autism Diagnostic Observation Schedule (ADOS) Social Affect subscale. These symptoms decrease with increasing Glx in the posterior corona radiata (PCR). (For correlations elsewhere in the brain and with other metabolites see Supplemental Figures S3–SS7.) All analyses covary for age, sex, FSIQ, and use of any psychotropic medication and are corrected for multiple comparisons using false discovery rate (FDR).

