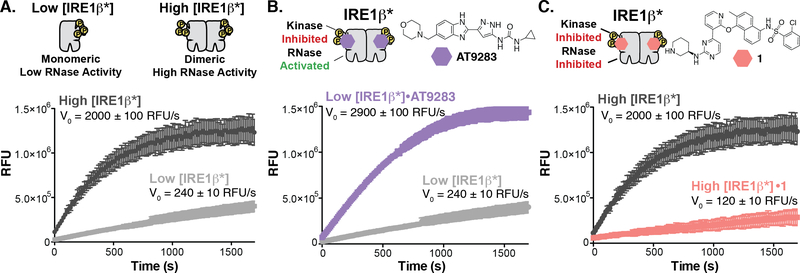
Figure 2. Divergent Modulation of IRE1β’s RNase Domain with ATP-Competitive Inhibitors.
A. Concentration regimes for testing the allosteric modulation of IRE1β*’s RNase domain. (top) Schematic of the oligomeric states of Low [IRE1β*] and High [IRE1β*]. (bottom) Real time fluorescence curves and initial rates for Low [IRE1β*] and High [IRE1β*]. Data shown are mean ± SEM, n=3. B. Activation of IRE1β*’s RNase activity. (top) Structure of the ATP-competitive RNase activator AT9283. (bottom) Real time fluorescence curves and rates of XBP1 mini-substrate cleavage for Low [IRE1β*] treated with DMSO (light gray) or AT9283 (purple) in the in vitro RNase assay. Data shown are mean ± SEM, n=3. C. Inhibition of IRE1β*’s RNase activity. (top) Structure of KIRA 1. (bottom) Real time fluorescence curves and rates of XBP1 mini-substrate cleavage for High [IRE1β*] treated with DMSO (dark gray) or 1 (coral) in the in vitro RNase assay. Data shown are mean ± SEM, n=3.

