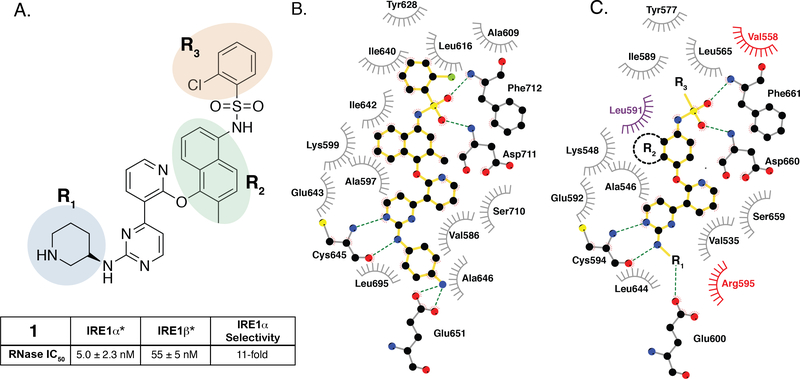
Figure 3. SAR of ATP-Competitive KIRAs.
A. Chemical structure of KIRA 1 (top). Structural elements of 1 that are varied in our study are colored. RNase IC50 values for 1 against both IRE1α* and IRE1β* and the fold selectivity for IRE1α (bottom). Inhibitor data are shown as the mean ± SEM, n=3. B. LigPlot map detailing the binding interactions (yellow sticks) between inhibitor 2, a close analog of 1, and the ATP-binding site of IRE1α (PDB: 4U6R). Residues involved in hydrogen-bond interactions are shown as sticks. Residues involved in hydrophobic interactions are shown as gray eyelashes. C. LigPlot map detailing the hypothesized binding pocket of IRE1β and its interactions with pyridine-pyrimidine based ligands. Residues that are conserved between IRE1β and IRE1α are shown in gray. Conservative mutations are shown in purple and non-conservative mutations are shown in red.

