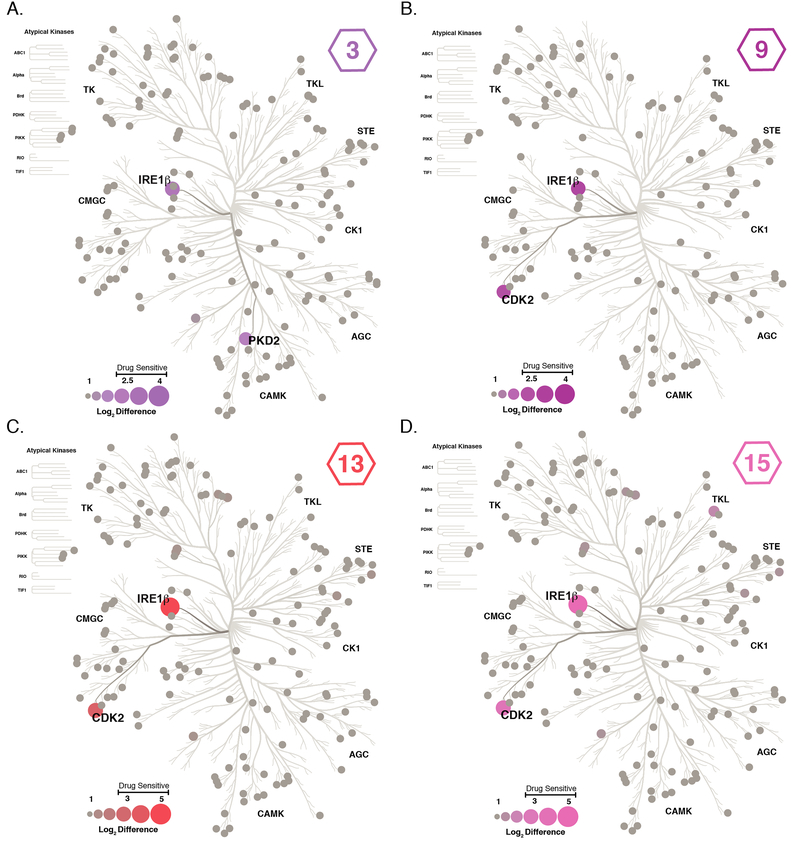
Figure 5. Kinome Profiling of KIRAs 3, 9, 13, and 15.
The kinome selectivity of 3, 9, 13, and 15 were determined with a previously described kinobead lysate profiling method. Kinases that were quantified in the experiment are shown as circular nodes, where node size and color has been scaled to the log2 difference (difference in LFQ intensity between DMSO treated and inhibitor treated lysates) between DMSO and treatment with 10 μM of KIRA 3 (A), 9 (B), 13 (C), or 15 (D). Gray nodes represent kinases that were quantified but no competition with an inhibitor was observed. Values shown are the mean of four replicates.

