. Author manuscript; available in PMC: 2020 Dec 20.
Published in final edited form as: ACS Chem Biol. 2019 Oct 14;14(12):2595–2605. doi: 10.1021/acschembio.9b00482

Table 1.

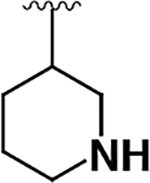
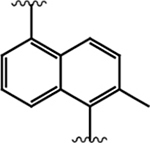
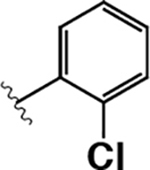
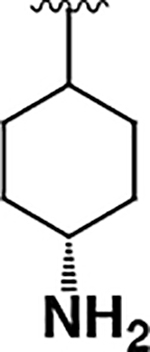
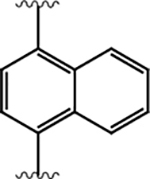
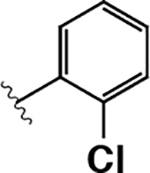
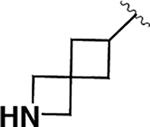
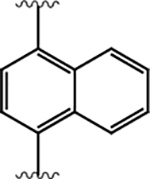
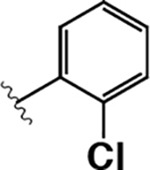
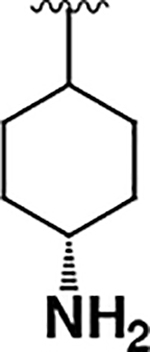
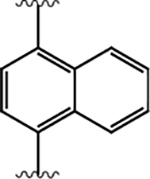
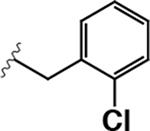
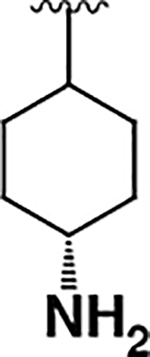
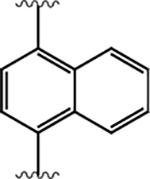
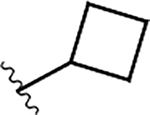
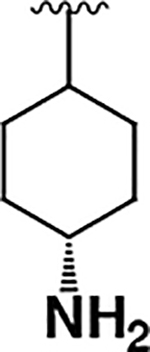
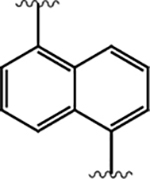
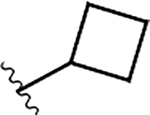
SAR of KIRAs Containing Naphthyl R2 Groupsa
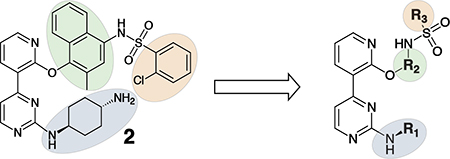
graphic file with name nihms-1055716-t0009.jpg
compd R1 R2 R3 IRE1β RNase IC50 (nM) IRE1α RNase IC50 (nM) IRE1β RNase Selectivity (Fold)
1 graphic file with name nihms-1055716-t0010.jpg graphic file with name nihms-1055716-t0011.jpg graphic file with name nihms-1055716-t0012.jpg 55 ± 5 5.0 ± 2.3 0.09
3 graphic file with name nihms-1055716-t0013.jpg graphic file with name nihms-1055716-t0014.jpg graphic file with name nihms-1055716-t0015.jpg 15 ± 2 22 ± 9 1.4
4 graphic file with name nihms-1055716-t0016.jpg graphic file with name nihms-1055716-t0017.jpg graphic file with name nihms-1055716-t0018.jpg 100 ± 10 430 ± 230 4.2
5 graphic file with name nihms-1055716-t0019.jpg graphic file with name nihms-1055716-t0020.jpg graphic file with name nihms-1055716-t0021.jpg 490 ± 20 9.4 ± 1.0 0.02
6 graphic file with name nihms-1055716-t0022.jpg graphic file with name nihms-1055716-t0023.jpg graphic file with name nihms-1055716-t0024.jpg >20000 10 ± 1 <0.0005
7 graphic file with name nihms-1055716-t0025.jpg graphic file with name nihms-1055716-t0026.jpg graphic file with name nihms-1055716-t0027.jpg 14000 ± 4000 42 ± 5 0.003
a

RNase IC50 data are shown as mean ± SEM, n=3. RNase selectivity was determined by dividing IRE1α* RNase IC50 by IRE1β* RNase IC50 value for each inhibitor (individual IC50 curves provided in Supp. Figure 2).