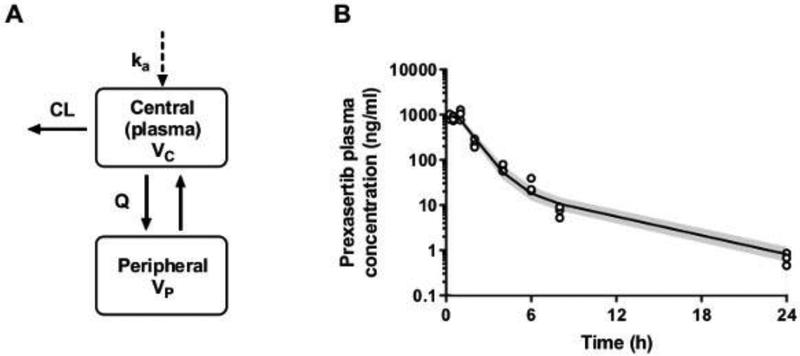
Figure 1. Prexasertib plasma pharmacokinetic model and visual predictive checks.
(A) Prexasertib plasma pharmacokinetic model structure: a two-compartment linear model parameterized with apparent central clearance (CL) and volume (Vc), peripheral clearance (Q) and volume (Vp), and an absorption rate constant (ka) to describe the subcutaneous administration. (B) Prexasertib plasma concentration-time profile in mice bearing G3MB: observations (open-circles) vs model predictions. The solid line represents the median of model predictions, and the shaded area depicts the 90th prediction interval.

