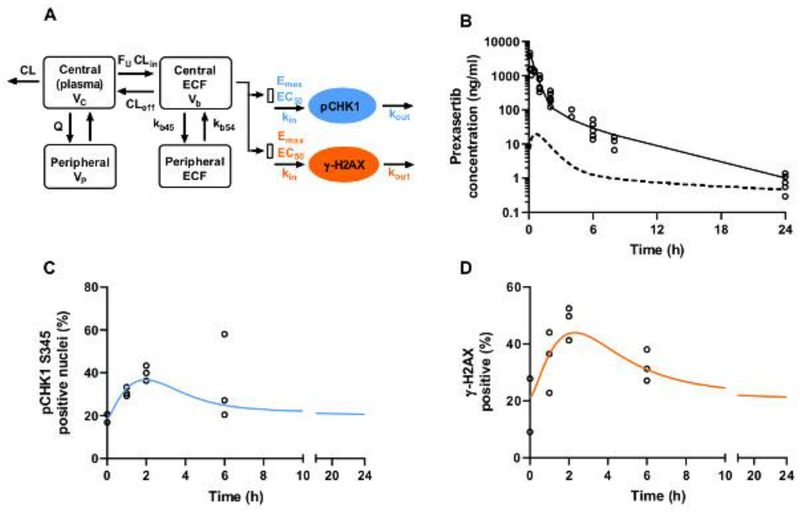
Figure 4. Prexasertib pharmacokinetic-pharmacodynamic model and predictions.
(A) Indirect response model used to predict pCHK1 S345 and γ-H2AX dynamics. kin and kout represent the production and degradation rates. Prexasertib ECF concentrations were used to stimulate kin with an Emax/EC50 model. Emax is the maximum extent of simulation, and EC50 is the prexasertib ECF concentration for 50% stimulation of maximum function of kin. (B) Prexasertib observed concentrations (open-circles), mean predicted prexasertib plasma concentration-time profile (solid line), and mean predicted ECF concentration-time profile (dashed line) after 20 mg/kg IV. (C) pCHK1 S345 observations (open-circles) and model predictions (solid line). (D) γ-H2AX observations (open-circles) and model predictions (solid line).

