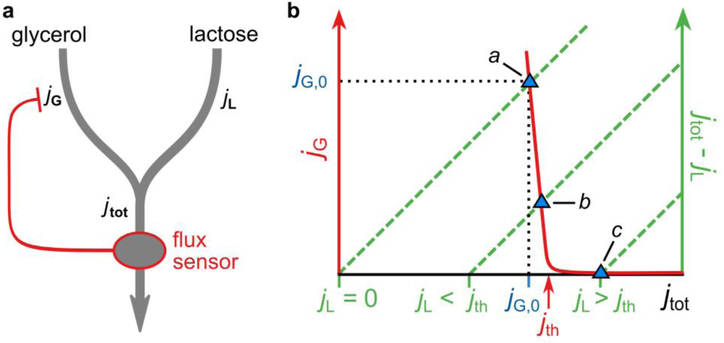
Extended Data Figure 5. The total-flux feedback model.
Several key observations can be explained by a highly simplified regulatory scheme in which glycerol uptake is inhibited by a signal that reflects the total carbon-uptake flux—a total-flux sensor. In this scheme (Panel a), glycerol and lactose uptake jG and jL both contribute to the total carbon-uptake flux jtot. This total flux is sensed by a total-flux sensor, which represses glycerol uptake, but only if jtot exceeds a threshold that is set to coincide with the carbon flux obtained on glycerol alone. Thus, glycerol uptake is suppressed by any substrate that supplies a larger carbon-uptake flux than glycerol can provide, but not by substrates that produce a smaller flux.
Panel b demonstrates graphically how total-flux feedback determines the uptake of glycerol. Because jG = jtot − jL, the steady-state value of jG obtained for a given jL can be found by plotting both jG(jtot) (red solid curve) and jtot − jL (green dashed lines, for various values of jL ) as a function of jtot and determining their intersection (blue triangles). We assume that jG responds sensitively to jtot, with a threshold jth (red arrow) set slightly above the flux on glycerol alone, jG,0. Thus, it is seen that glycerol uptake is inhibited if jL > jth (the hierarchical utilization regime, intersection c). Yet, if jL < jth, glycerol uptake is adjusted such that jtot ≈ jth ≈ jG,0 (the supplementation regime; intersection a and b).
cAMP–Crp signaling can function as a total-flux sensor because transcriptional activation by cAMP–Crp is a decreasing function of jtot (Fig. 4c)5. It transmits information on jtot to the glycerol uptake through differential regulation of glpK and glpD expression (Fig. 3b,c).

