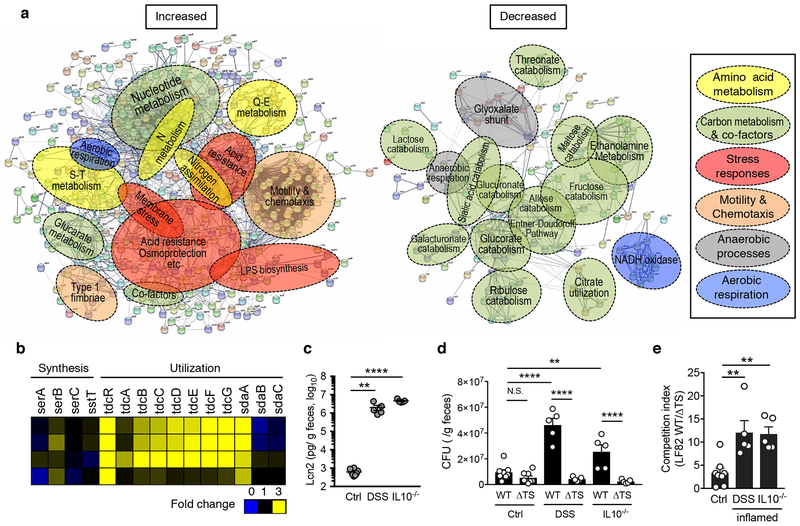
Figure 1. E. coli reprograms its metabolism and utilizes serine in the inflamed gut.
(a) Germ-free (GF) mice were mono-colonized with E. coli LF82 for 1 week. E. coli mono-colonized mice were then treated with 1.5% DSS for 5 days. Cecal contents were harvested and microbial gene expression was analyzed by RNA-seq (N=4, biologically independent animals). A network analysis of bacterial genes up- (Left) and down-regulated (Right) in the inflamed gut (≥ 2.0-fold change) using the STRING protein–protein interaction database. The functional gene annotation was obtained from DAVID. Networks were exported with confidence view settings in which line thickness indicates the strength of data support. Each node (small circle) represents a gene up- or down-regulated in this analysis. The formed gene clusters were differentially colored with functional definitions as described in the box and shown as overlaid circles. (b) Fold increase (DSS/no DSS) of serine metabolism pathway genes. (c, d) Naïve SPF C57BL/6 mice (Control), DSS treated mice (day 5 post 3.0% DSS treatment), and colitis-developed Il10−/− mice were co-inoculated with LF82 WT and ΔtdcΔsda (ΔTS) mutant (1 x 10⁹ CFU each/mouse, N=5-8, biologically independent animals). Fecal samples were collected 24 hrs post inoculation. (c) Presence of active inflammation was verified by measuring fecal Lcn2 levels. Dots indicate individual mice with mean ± s.e.m. (d) Bacterial CFUs for each strain were measured by plating. Dots indicate individual mice with geometric mean ± s.d. (e) The competitive index of WT/ΔTS mutant is shown. Dots indicate individual mice with geometric mean ± s.d. N.S.; not significant, **; P < 0.01, ***; P< 0.001, **** P < 0.0001 by 1-Way ANOVA followed by Bonferroni post-hoc test.

