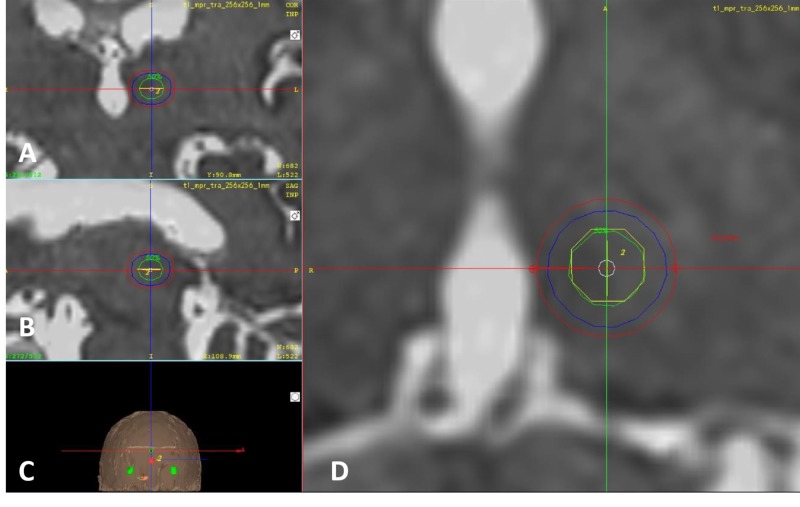
Figure 3. Three-dimensional close-up of the 4-mm shoot.
(A) Coronal. (B) Sagittal. (C) Three-dimensional reconstruction of the skin. (D) Axial. The green isodose curve represents 50% of the dose (70 Gy), the blue isodose curve in the middle represents dose gradient to 25% of the dose (35 Gy), and the most external red isodose curve represents 24 Gy. The diameter of the area receiving 24 Gy or more of radiation measures 10 mm.

