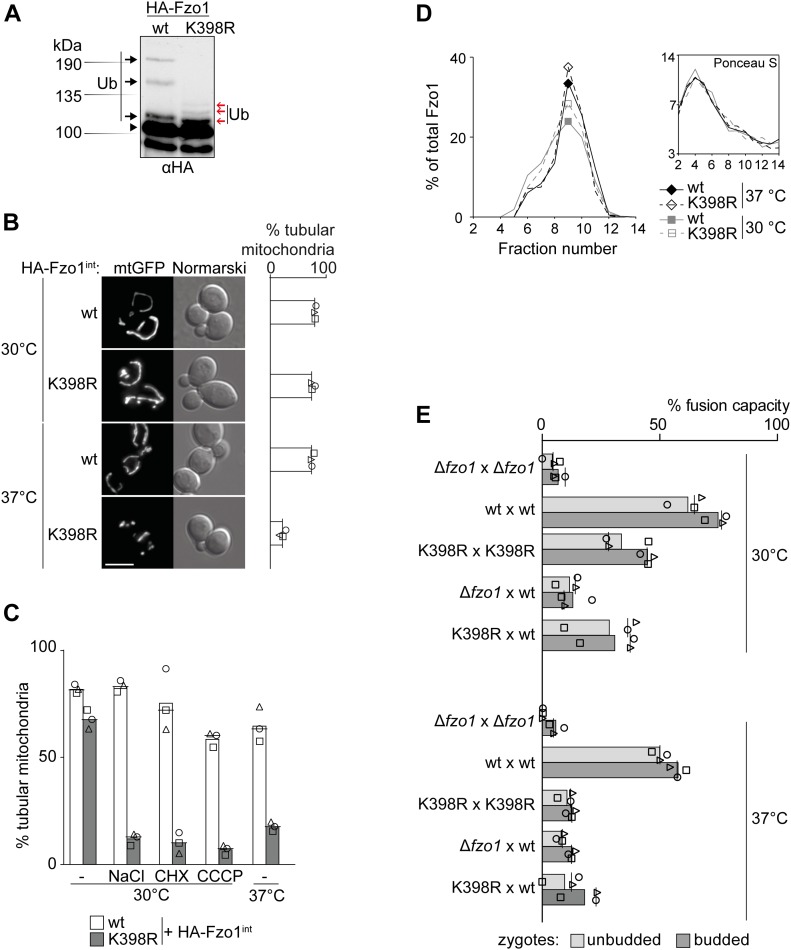
Figure 1. Conserved ubiquitylation pattern of Fzo1 is required on both fusion partners to drive efficient mitochondrial membrane fusion.
(A) Fzo1 and Fzo1K398R ubiquitylation pattern. Crude mitochondrial extracts from cells expressing HA-Fzo1 or HA-Fzo1K398R were solubilized, subjected to HA-immunoprecipitation and analysed by SDS–PAGE and Western blot using an HA-specific antibody. Unmodified and conserved ubiquitylated forms of Fzo1 are indicated by a black arrowhead or black arrows, respectively. K398R-specific ubiquitylation is indicated by red arrows. (B) Mitochondrial morphology of cells expressing genomically HA-tagged Fzo1 or Fzo1K398R. Cells expressing HA-tagged Fzo1 (wt) or Fzo1K398R (K398R) were analysed for mitochondrial tubulation after expressing a mitochondrial-targeted GFP plasmid. Cellular (Nomarski) and mitochondrial (mtGFP) morphology were visualized by fluorescence microscopy. Right panel: quantification of three independent experiments (with more than 200 cells each), depicting the percentage of tubular mitochondria. Individual relative values, mean, and median are indicated by geometric symbols, bar, and horizontal line, respectively. Scale bar; 5 μm. (C) Mitochondrial morphology of cells expressing HA-Fzo1 and HA-Fzo1K398R upon cellular stresses. Cells expressing genomically integrated HA-Fzo1 and HA-Fzo1K398R were grown to the exponential growth phase at 30°C. Cultures were then divided and further grown for 1 h at 37°C or at 30°C without any treatment or with high salt (0.5 M NaCl), sublethal doses of cycloheximide (1.7 μM CHX) or CCCP for mitochondrial membrane uncoupling (10 μM). Mitochondrial morphology was analysed as in Fig 1B. The quantification of three independent experiments shows the mean (bar), the median (line), and the individual values (geometric symbols) in % tubular mitochondria. (D) Complex formation of HA-tagged Fzo1 or Fzo1K398R. Sucrose gradient centrifugation was performed with solubilized crude mitochondrial extracts of strains genomically expressing HA-tagged Fzo1 or Fzo1K398R grown at 30°C and 37°C. Gradients were fractionated, proteins were precipitated with trichloroacetic acid, and the samples were analysed by SDS–PAGE and Western blot using an HA-specific antibody. HA signals and Ponceau S staining (inset: used as a gradient fractionation control) were quantified. (E) In vivo fusion assay. Early mating stages (unbudded zygotes) and late mating stages (budded zygotes) are scored. Mating of ∆fzo1 cells (a or α) expressing 3xMyc-Fzo1 or 3xMyc-Fzo1K398R and mtGFP or mtRFP, each under the control of an inducible GAL1 promoter. The cells were grown in SC supplemented with 2% raffinose to the exponential growth phase. 2% galactose was added for 1 h to induce Fzo1 expression. 2% glucose was then added to stop Fzo1 expression. The cells were mixed 1 h after glucose addition, and fluorescence microscopy pictures were taken after an additional 8 h. The mixing of fluorophores within the mitochondria was quantified. Homotypic and heterotypic mating was performed, at 30°C and 37°C, and mixing of mitochondria was observed in unbudded (light grey) or budded (dark grey) zygotes. The quantification of three independent experiments (30 or more mating events each) shows the mean (bar), the median (line), and the individual values (geometric symbols) in % fusion capacity. Ub, ubiquitin.

