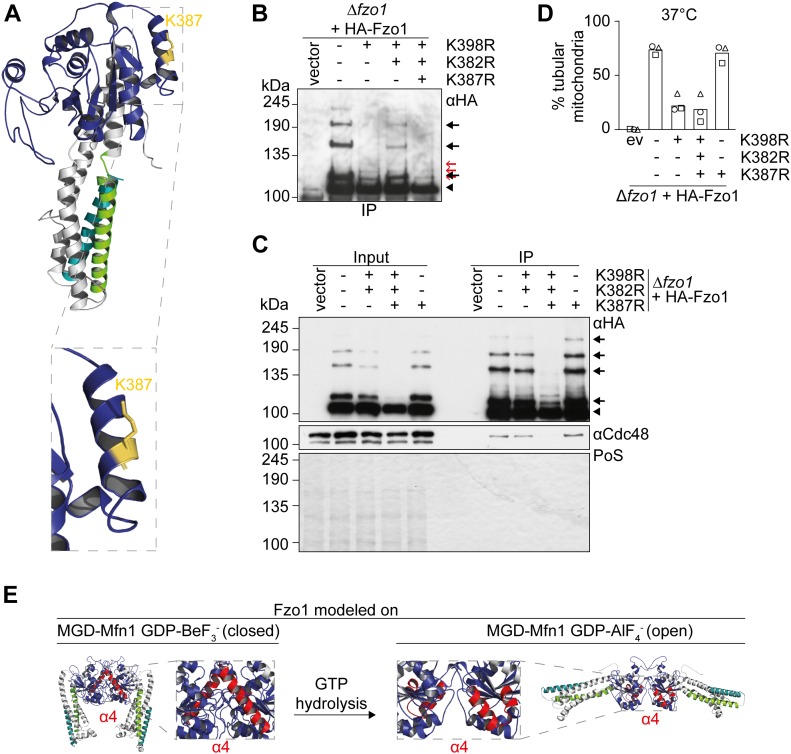
Figure 5. Combined lysine mutations in Fzo1 reveal an important role of the GTPase α4.
(A) MGD-Fzo1K398,382R was modelled on MGD-MFN1 as described in Fig 4A (Cscore −2,52). Residue 387 is annotated in yellow. The inset shows a zoom-in of α4 of the GTPase domain. (B) Analysis of Fzo1 ubiquitylation of cells expressing HA-tagged Fzo1 mutated for K398R and/or K382R and/or K387R. Crude mitochondrial extracts of cells expressing wt or mutants of HA-Fzo1, as indicated, were solubilized, subjected to immunoprecipitation, and analysed by SDS–PAGE and Western blot, using an HA-specific antibody. Forms of Fzo1 are indicated as in Fig 1A. (C) Analysis of Cdc48 co-immunoprecipitation with HA-tagged Fzo1, Fzo1K398,382R, Fzo1K398,382,387R, or Fzo1K387R. Crude mitochondrial extracts from Δfzo1 cells expressing the indicated mutants of HA-tagged Fzo1 were solubilized, subjected to immunoprecipitation, and analysed by SDS–PAGE and Western blot using HA- and Cdc48-specific antibodies. Forms of Fzo1 are indicated as in Fig 1A. (D) Mitochondrial morphology of cells expressing HA-tagged Fzo1 mutated for K398R and/or K382R and/or K387. Mitochondrial morphology of cells expressing wt or mutants of HA-Fzo1, as indicated, and grown at 37°C was analysed as in Fig 1B. (E) Structural model of Fzo1 modelled on MFN1-MGD. Fzo1-MGD was modelled on MFN1-MGD bound to GDP-BeF3− (centre left, PDB ID: 5YEW, c-score −1.17) (Yan et al, 2018) or GDP-AlF4− (centre right, PDB ID: 5GOM, c-score −1.24) (Cao et al, 2017). Structures are depicted as closed and open dimers, indicating pre-hydrolysis and post-hydrolysis states, respectively. PoS, Ponceau S.

