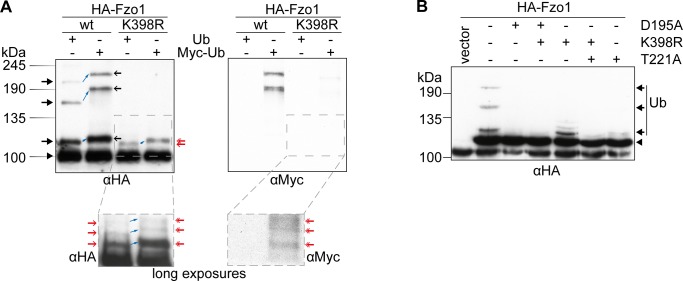
Figure S1. Analysis of ubiquitylated forms of Fzo1.
(A) Analysis of the ubiquitin pattern of Fzo1 using Myc-tagged and untagged ubiquitin. Cells expressing HA-tagged Fzo1 or Fzo1K398R and expressing either untagged or Myc-tagged ubiquitin were grown to the exponential growth phase. Crude mitochondrial extracts thereof were subjected to HA-immunoprecipitation, SDS–PAGE, and Western blot, using HA- and Myc-specific antibodies. To adjust the amount of unmodified Fzo1 from the two different backgrounds (Ub or Myc-Ub expressing cells), 1.4× the amount of sample of Myc-Ub expressing cells were loaded in comparison to the Ub expressing cells. The left blot shows the Input, the right blot shows the eluate, the insets at the bottom show long exposures of the HA-signal (left) or Myc signal (right) of the blots on top. A black arrowhead indicates unmodified Fzo1, black arrows indicate ubiquitin forms of wt Fzo1, red arrows indicate ubiquitin forms of Fzo1K398R. Black open arrows indicate Myc-Ub–containing forms of wt Fzo1 and red double arrows indicate Myc-Ub–containing forms of K398R Fzo1. (B) Analysis of the ubiquitylation pattern of Fzo1 in GTP binding and hydrolysis mutants. pre1-1 hypomorphic mutant cells expressing HA-tagged Fzo1 harbouring the indicated mutations (GTP binding mutant [D195A]; GTP hydrolysis mutant [T221A]) were grown to the exponential growth phase. Crude mitochondrial extracts thereof were subjected to HA-immunoprecipitation, SDS–PAGE, and Western blot, using an HA-specific antibody. Forms of Fzo1 are indicated as in Fig 1A. Ub, ubiquitin.

