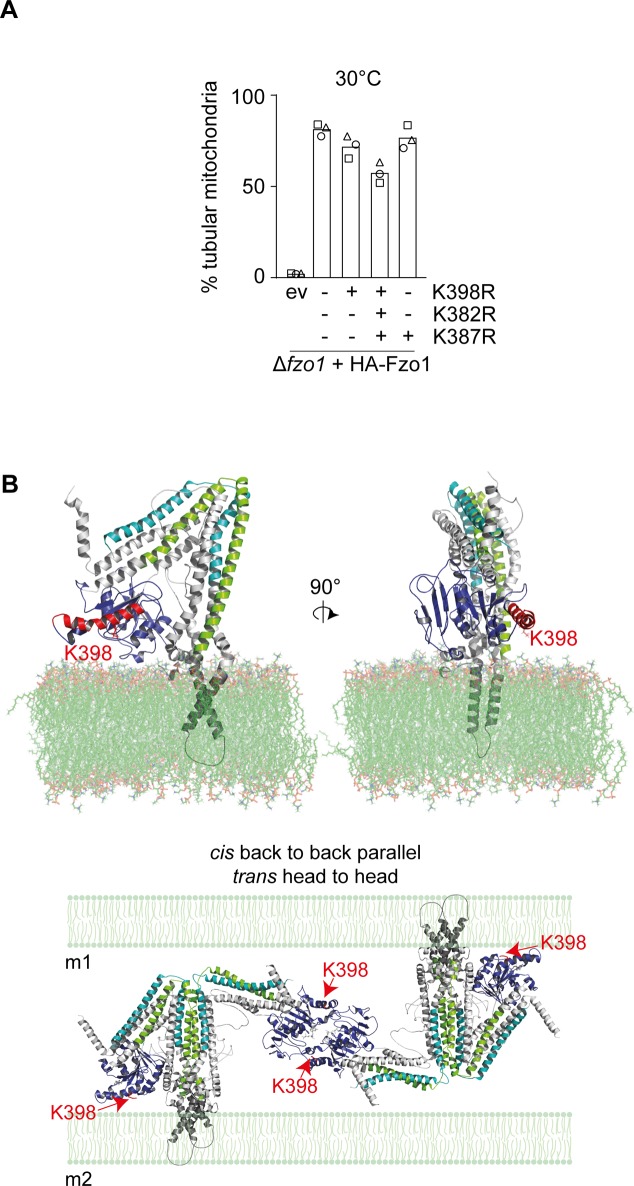
Figure S7. GTPase α4 in a membrane context.
(A) Mitochondrial morphology of cells expressing HA-tagged Fzo1 mutated for K398R and/or K382R and/or K387. Cells expressing wt or mutants of HA-Fzo1, as indicated, and grown at 30°C were analysed as in Fig 1B. (B) Membrane inserted model of full-length Fzo1 based on BDLP (De Vecchis et al, 2017). Fzo1 domains are coloured as in Fig 4A. Transmembrane domains are coloured in grey. Top panel: the green surface represents POPE and POPC lipids from a portion of the bilayer. α4 is shown in red. K398 is shown as a red stick. Bottom panel: proposed model complex for Fzo1 trans-tethering interactions (Brandner et al, 2019). Representation of a trans tetramer accounting cis parallel back-to-back and trans head-to-head interactions. Fzo1 domains and K398 are coloured as in the top panel. Membrane is shown in light green (bottom). m1, membrane 1; m2, membrane 2.

