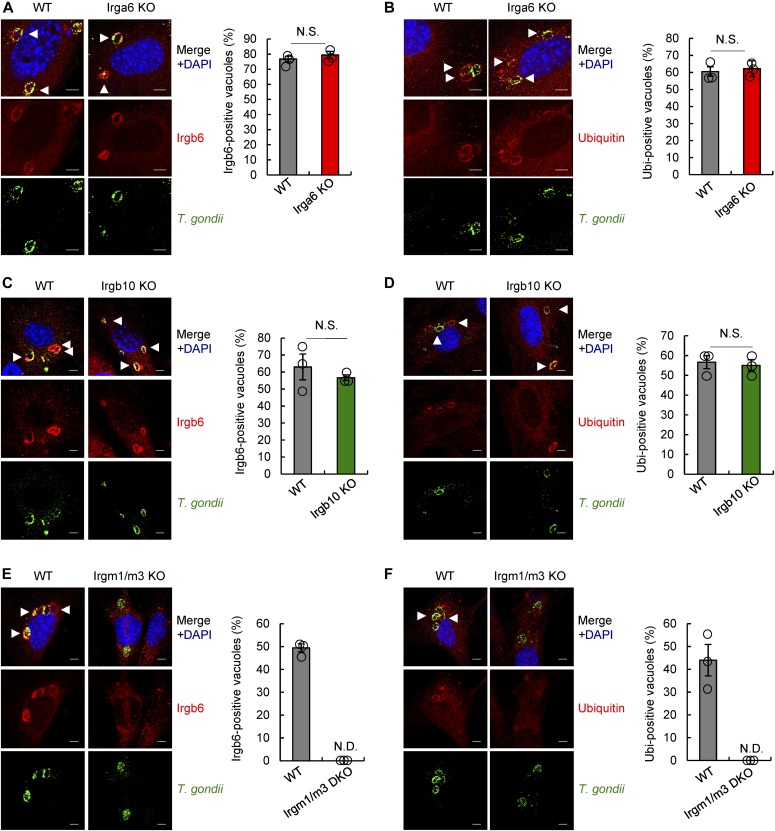
Figure 3. Regulator IRG proteins, but not other effector IRG proteins, are required for loading of Irgb6 and ubiquitin on T. gondii PVM.
(A, B) Confocal microscope images (left) and the graphs (right) represent the localization of Irgb6 (A) and ubiquitin (B) (red) to T. gondii vacuoles (green), and DAPI (blue) at 4 h postinfection in IFN-γ–treated WT and Irga6 KO MEFs. (C, D) Confocal microscope images (left) and the graphs (right) represent the localization of Irgb6 (C) and ubiquitin (D) (red) to T. gondii vacuoles (green), and DAPI (blue) at 4 h postinfection in IFN-γ–treated WT and Irgb10 KO MEFs. (E, F) Confocal microscope images (left) and the graphs (right) represent the localization of Irgb6 (E) and ubiquitin (F) (red) to T. gondii vacuoles (green), and DAPI (blue) at 4 h postinfection in IFN-γ–treated WT and Irgm1/m3 DKO MEFs. All graphs show the mean ± SEM in three independent experiments. All images are representative of three independent experiments. White arrowheads indicate colocalization. Scale bars, 5 μm. ND, not detected; NS, not significant.

