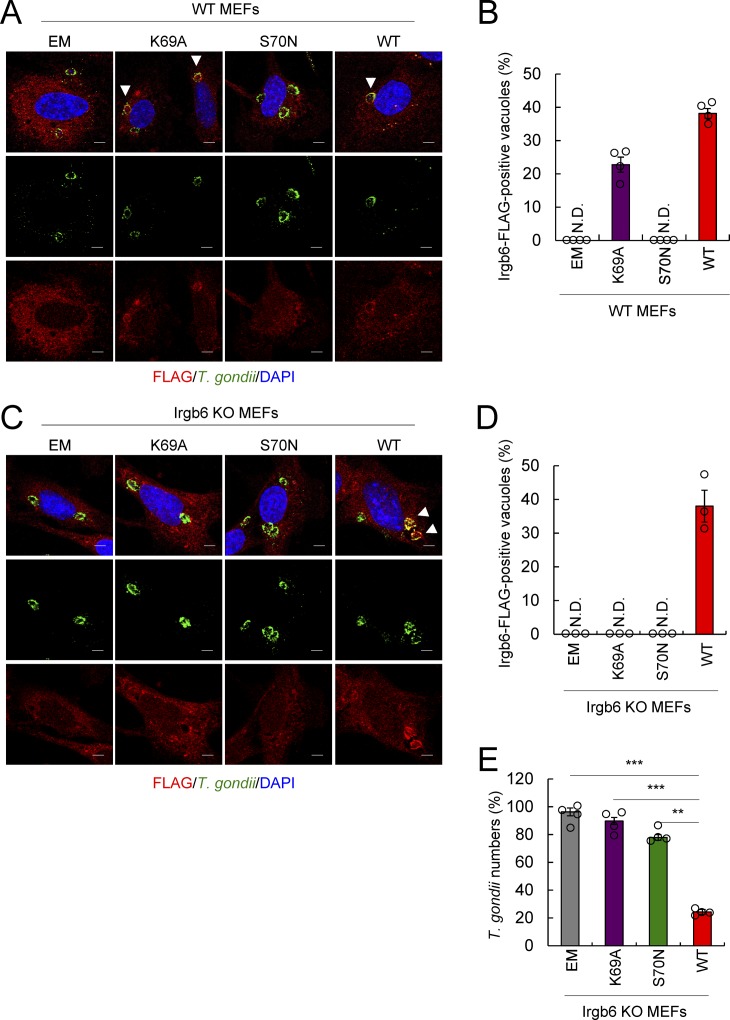
Figure S4. The GTP-binding motif of Irgb6 is essential for localization on the PVM and IFN-γ–induced parasite killing activity.
(A, B) The representative images (A) and the ratio (B) of Irgb6-positive parasites by confocal microscopy analysis at 4 h postinfection in IFN-γ–treated WT MEFs reconstituted with EM, K69A-Irgb6-FLAG, S70N-Irgb6-FLAG, or WT-Irgb6-FLAG. Scale bars, 5 μm. (C, D) The representative images (C) and the ratio (D) of Irgb6-positive parasites by confocal microscopy analysis at 4 h postinfection in IFN-γ–treated Irgb6 KO MEFs reconstituted with EM, K69A-Irgb6-FLAG, S70N-Irgb6-FLAG, or WT-Irgb6-FLAG. Scale bars, 5 μm. (E) The parasite survival rate in the presence of IFN-γ stimulation relative to that in the non–IFN-γ–treated control by luciferase analysis at 24 h postinfection in Irgb6 KO MEFs reconstituted with EM, K69A-Irgb6-FLAG, S70N-Irgb6-FLAG, or WT-Irgb6-FLAG. (B, D, E) All graphs show the mean ± SEM in three or four independent experiments. (A, C) All images are representative of three or four independent experiments. (A, C) White arrowheads indicate colocalization. **P < 0.01 and ***P < 0.001 from the two-tailed t test. ND, not detected.

