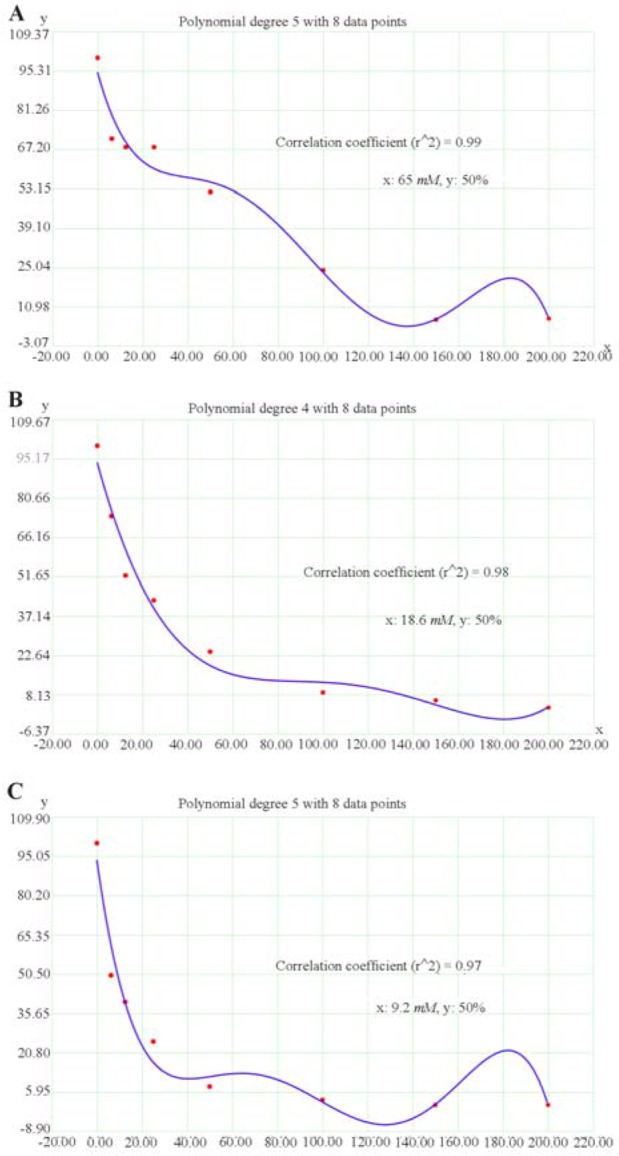
Figure 2.

Regression analyses to calculate the 50% inhibiting concentration (IC50) values for effect of sodium butyrate (SB) on HT-29 human colorectal cell line. The horizontal axis (x) represents the concentration (mM) and the vertical axis (y) represents the percentage of the cell viability. A) The IC50 value was 65 mM for 24 hr after treatment, B) 18.6 mM for 48 hr after treatment, and C) 9.2 mM for 72 hr after treatment.
