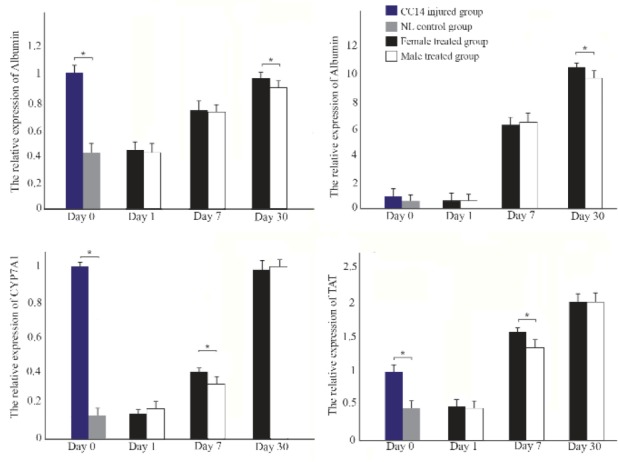
Figure 5.

RT-PCR detection of the mRNA expression of hepatic genes in liver tissues from different groups. Data were normalized to corresponding β-Actin and calculated in reference to control normal (NL) group. *p<0.05.

RT-PCR detection of the mRNA expression of hepatic genes in liver tissues from different groups. Data were normalized to corresponding β-Actin and calculated in reference to control normal (NL) group. *p<0.05.