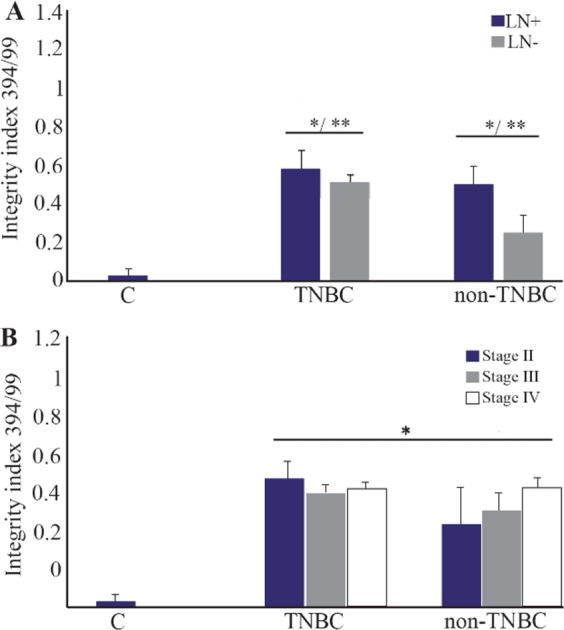
Figure 3.

The cfDNA integrity index in TNBC and non- TNBC groups based on lymph node involvement (A) and breast cancer stages (B).
* compared with normal control, Mann-Whitney test, p<0.001.
** LN+ compared with LN-, Mann-Whitney test, p<0.01.
TN: Triple negative breast cancer. LN: Lymph node
