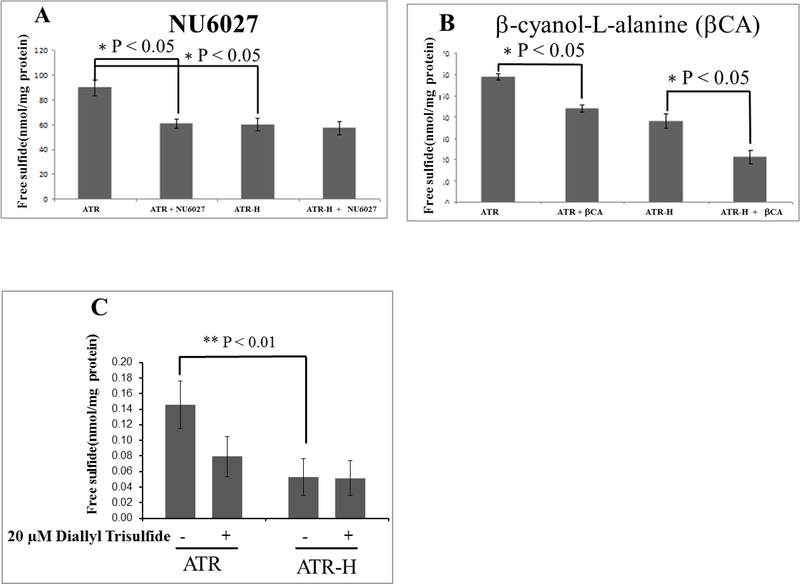
Figure 2.
Free cellular H2S concentrations in the ATR wild-type cells compared to the ATR-H mutant cells. Figure 2A, H2S concentrations were compared in ATR and ATR-H, with and without the ATR kinase inhibitor NU6027. The cells were treated for two hours with 12 μM NU6027 in standard media and harvested (2A). Figure 2B, H2S concentrations were compared in ATR and ATR-H, with and without the CBS and CSE inhibitor β-cyanol-L-alanine. The cells were treated with 1 mM β-cyanol-L-alanine for two hours in standard media and harvested (2B). Figure 2C, H2S concentrations were compared in ATR and ATR-H, with and without 20μM diallyl trisulfide for two hours in standard media and harvested (2C). “βCA” = 1 mM β-cyanol-L-alanine. Free H2S is in nmol/mg protein.

