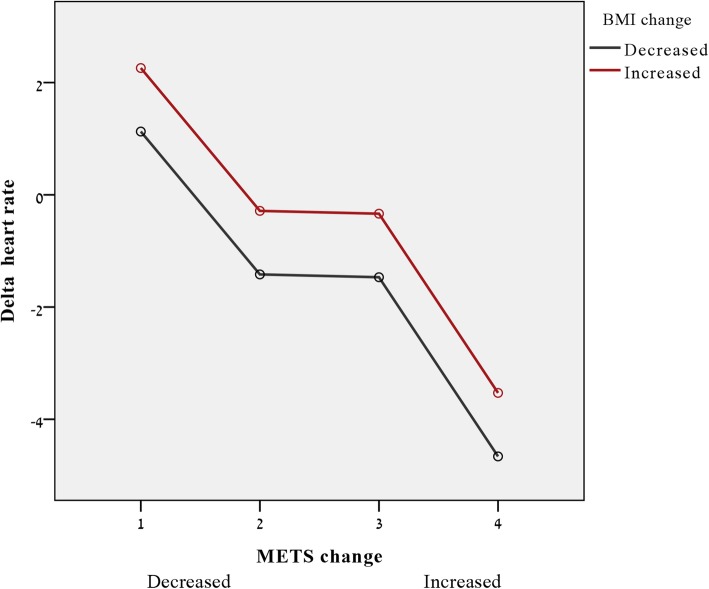
Fig. 3.
Plot of estimated effect on delta heart rate of both MET change (x axis, 1 = lowest, 4 highest MET change) and change of BMI (color coded, decreased = black, increased = red). Y axes indicate the estimated effect on delta heart rate (based on general linear regression model following adjustment to age, sex and basal heart rate

