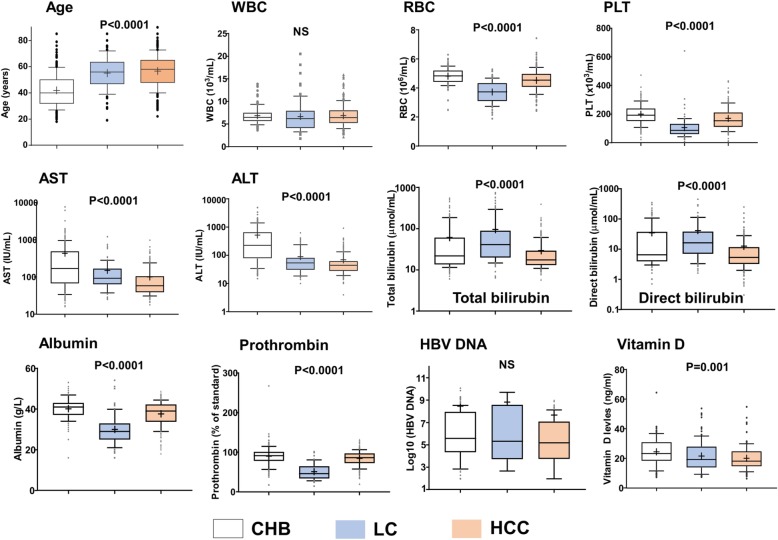
Fig. 3.
Comparison of clinical parameters in patient subgroups. CHB, chronic hepatitis B; LC, liver cirrhosis; HCC, hepatocellular carcinoma; PLT, platelets. AST and ALT, aspartate and alanine amino transferase; WBC, white blood cells; RBC, red blood cells; PLT, platelet; IU, international unit; NS, not significant. Box-plots illustrate medians with 25 and 75 percentiles with whiskers to 10 and 90 percentiles. P values were calculated by Kruskal-Wallis test

