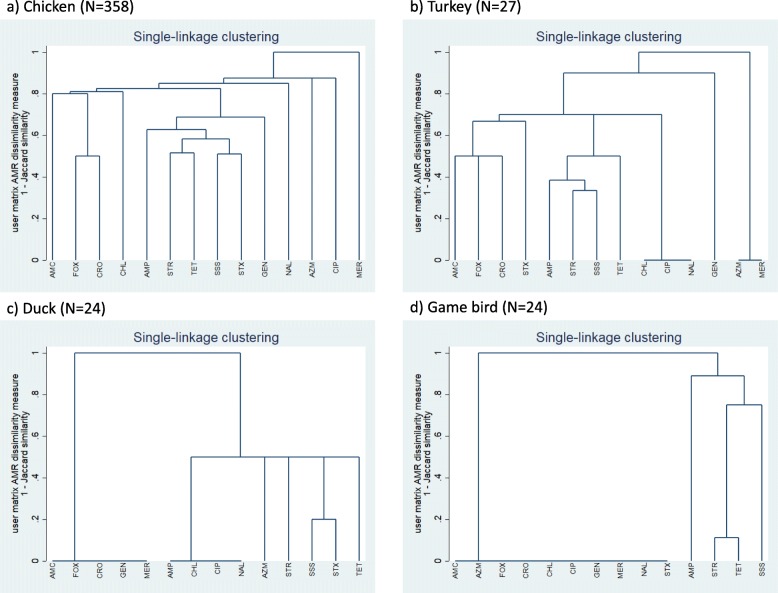
Fig. 2.
Single-linkage clustering dendrograms of resistance of fecal Escherichia coli isolates to antimicrobials, by poultry speciesABC. AGEN = gentamicin; STR = streptomycin; AMP = ampicillin; AMC = amoxicillin-clavulanic acid; CRO = ceftriaxone; FOX = cefoxitin; MER = meropenem; SSS = sulfisoxazole; STX = trimethoprim-sulfamethoxazole; AZM = azithromycin; CHL = chloramphenicol; CIP = ciprofloxacin; NAL = nalidixic acid; TET = tetracycline. BA cluster analysis, using the Jaccard binary similarity coefficient, was used to compare individual antimicrobials with respect to their similarity in the resistance status of E. coli. The Jaccard distance measures dissimilarity between antimicrobials and is obtained by subtracting the Jaccard binary similarity coefficient from one [27]. A high dissimilarity measure indicates that relatively few isolates were resistant to both antimicrobials, a low dissimilarity measure indicates that a relatively high proportion of isolates were resistant to both antimicrobials, and a dissimilarity measure of zero indicates that all isolates were susceptible to both antimicrobials

