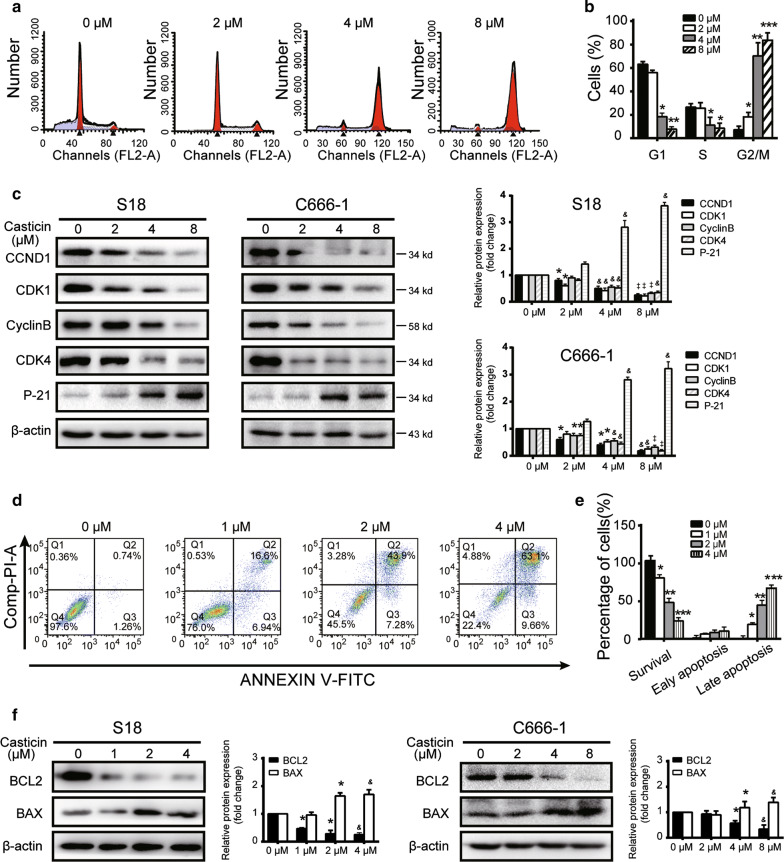
Fig. 2.
Casticin induces G2/M cell cycle arrest and apoptosis in NPC cells. a, b S18 cells were treated with casticin at concentrations of 0, 2, 4 or 8 µM for 24 h. Cell cycle distribution was analysed by flow cytometry. All data are presented as the mean ± standard deviation. *p < 0.05 versus 0 µM, **p < 0.01 versus 2 µM, and ***p < 0.001 versus 4 µM. c Levels of expression of cyclinD1, CDK1, cyclin B, CDK4, p21 were determined using Western blotting analysis in S18 and C666-1 cells after application of a gradient of casticin concentrations for 24 h. All data are presented as the mean ± standard deviations. *p < 0.05 versus 0 µM, &p < 0.5 versus 2 µM, and ‡p < 0.05 versus 4 µM. d, e Cell apoptosis was determined by flow cytometry after treatment with casticin at concentrations of 0, 1, 2, and 4 µM for 48 h. All data are presented as the mean ± standard deviation. *p < 0.05 versus 0 µM, **p < 0.01 versus 1 µM, and ***p < 0.001 versus 2 µM. f Levels of expression of apoptosis related proteins BCL2 and BAX in S18 cells with a gradient of casticin concentrations (0, 1, 2, 4 µM), and C666-1 with a gradient of casticn concentrations (0, 4, 8 or 16 µM) analyzed by Western blotting. All data are presented as the mean ± standard deviation, for S18 cells *p < 0.05 versus 0 µM, &p < 0.5 versus 1 µM; for C666-1 cells *p < 0.05 versus 0 µM, &p < 0.5 versus 4 µM. All the assays were performed in triplicate

