Fig. 3.

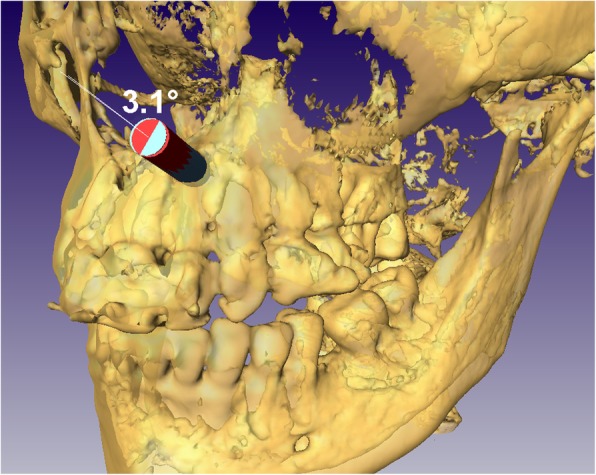
Analysis of angular deviation in Amira (blue: planned, red: realized). This figure does not depict the analysis of any of the actual cases, it is for illustration purposes only

Analysis of angular deviation in Amira (blue: planned, red: realized). This figure does not depict the analysis of any of the actual cases, it is for illustration purposes only