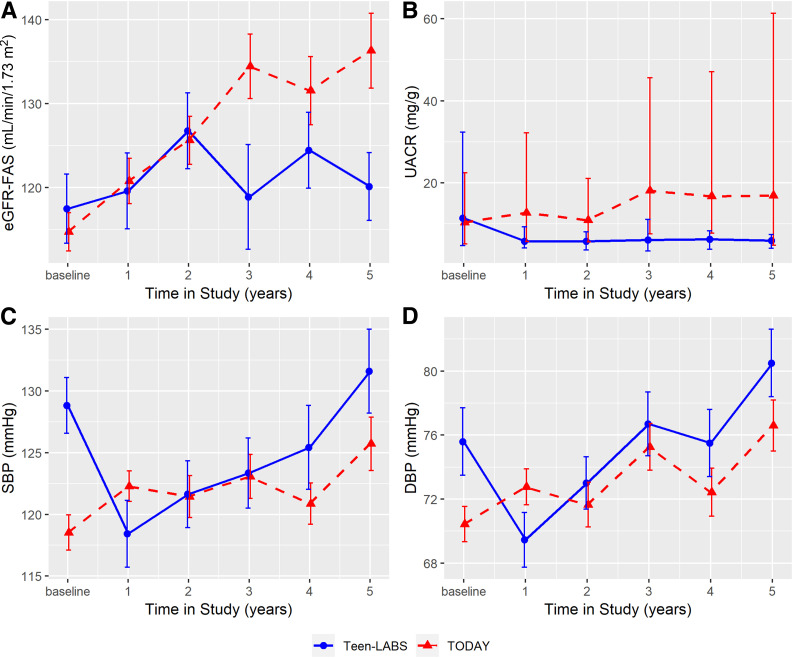
Figure 2.
eGFR, UACR, SBP, and DBP over 5 years in TODAY and Teen-LABS. Line charts for eGFR-FAS (P = 0.0243) (A), UACR (medians and IQRs) (B), SBP (P < 0.0001) (C), and DBP (P = 0.0245) (D). Error bars indicate ±SEM except for UACR. Means and error bars were jittered to avoid overlapping. P values are provided for the test of trajectory difference between groups over the study period (i.e., test for the existence of group ∗ time interaction terms). All models were adjusted for baseline age, sex, BMI, HbA1c, insulin sensitivity, and antihypertensive medication use.

