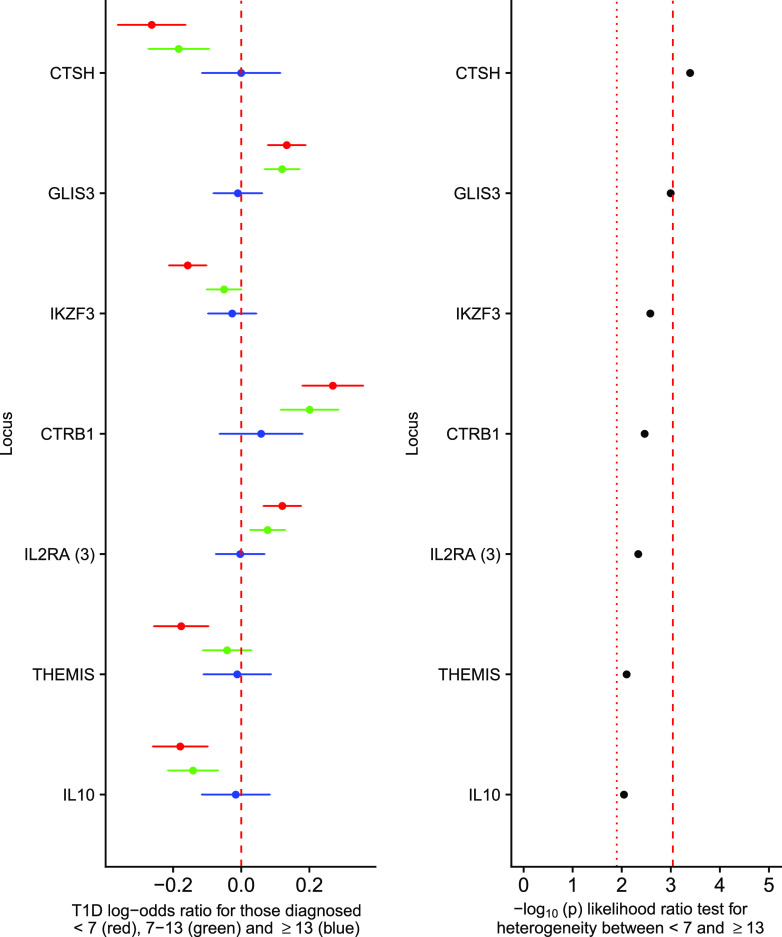
Figure 2.
Non-HLA type 1 diabetes–associated loci showing on the left panel the log-odds ratios for the minor allele for those diagnosed at <7 years old (red circle; log-odds ratio age at diagnosis ± 95% CI), 7–13 years old (green circle; log-odds ratio age at diagnosis 7–13 ± 95% CI), and ≥13 years old (blue circle; log-odds ratio age at diagnosis ≥13 ± 95% CI), from a multinomial logistic regression; the dashed red line shows a log-odds ratio of 0. The right panel shows the association statistics from a likelihood ratio test comparing a multinomial logistic regression constraining the log-odds ratios from the <7 to ≥13 groups to be equal compared with an unconstrained model. The red dotted line shows the threshold for FDR of <0.1, and the red dashed line shows the threshold for Bonferroni-corrected heterogeneity (showing only loci with an FDR of <0.1). T1D, type 1 diabetes.

