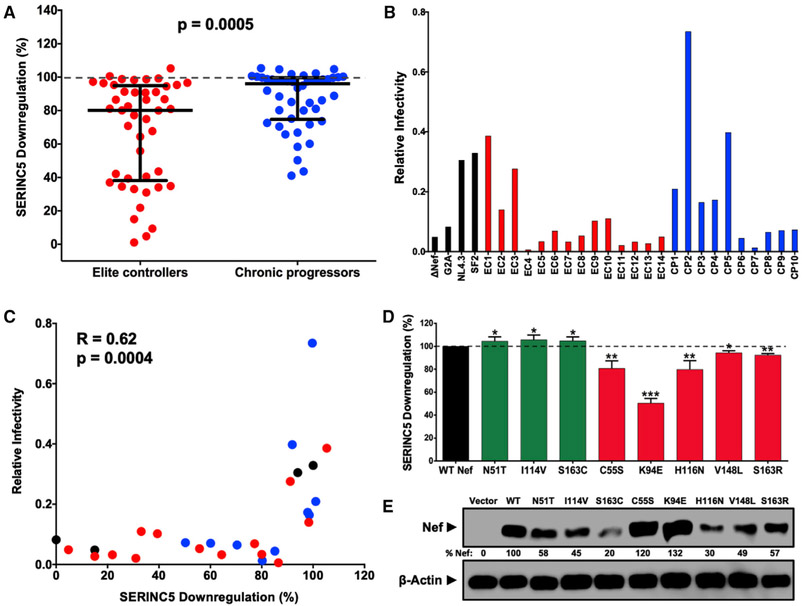
Figure 1. Lower SERINC5 Downregulation by Nef Isolates from HIV Controllers.
(A) SERINC5 downregulation function was compared between Nef clones from 45 elite controllers (EC; red) and 46 chronic progressors (CP; blue) (p < 0.001, Mann-Whitney U-test) using flow cytometry (see Figure S1; STAR Methods). Mean function of each clone (relative to Nef SF2 strain) is reported, on the basis of triplicate data from three independent experiments. Bars represent median (± interquartile range) of all EC or CP Nef clones.
(B) Relative infectivity of NL4.3 strains encoding 24 nef alleles (14 elite controllers, red; 10 chronic progressors, blue) and 4 controls (G2A, ΔNef, NL4.3 Nef, and SF2 Nef, black) was quantified as the quotient of infectivity for each virus generated in the presence of SERINC5 divided by that of the same virus generated in the absence of SERINC5. All viruses were tested at least twice in independent experiments. Mean results based on triplicate data from one representative experiment are shown.
(C) Correlation between SERINC5 downregulation and viral infectivity is shown for data described in (A) and (B) (Spearman R = 0.62, p = 0.0004).
(D) Eight Nef polymorphisms (see Table 1) were confirmed by mutagenesis. Results for mutants that were anticipated to increase (green) or decrease (red) SERINC5 downregulation function are reported as mean (±SD), on the basis of at least three independent experiments. Significant differences compared with NL4.3 Nef (100%) are indicated by asterisks (unpaired Student’s t test): *p < 0.05, **p < 0.01, and ***p < 0.001.
(E) Nef expression was assessed by western blot, and percentage relative to NL4.3 Nef is indicated.

