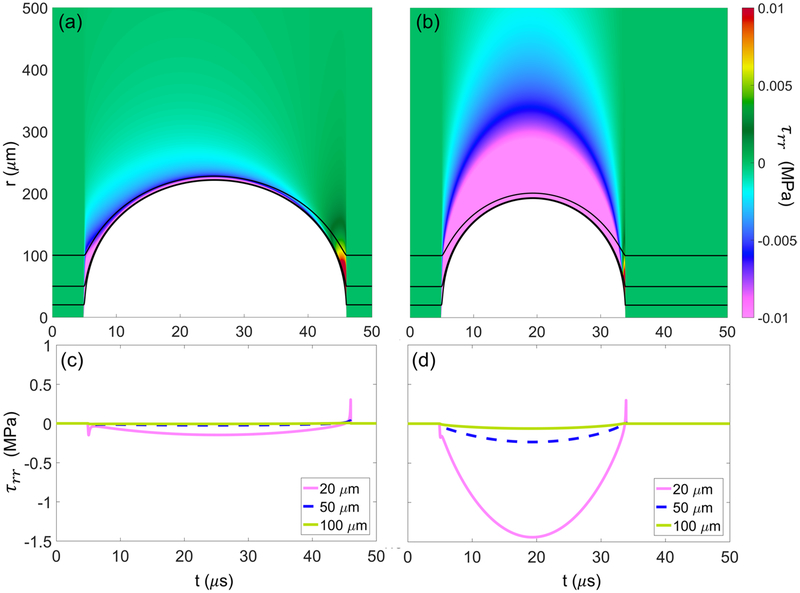
Figure 4.
Total deviatoric radial stress fields developed in liver (a) and HCC (b) exposed to 1 MHz waveform. White region corresponds to tissue deformation with respect to distance from the bubble nucleus as a function of time. Black lines correspond to Lagrangian paths taken by particles starting 20, 50, and 100 μm from the bubble nucleus. Plots (c) and (d) show the numerical magnitudes of total stress along the Lagrangian paths shown in (a) and (b), respectively.

