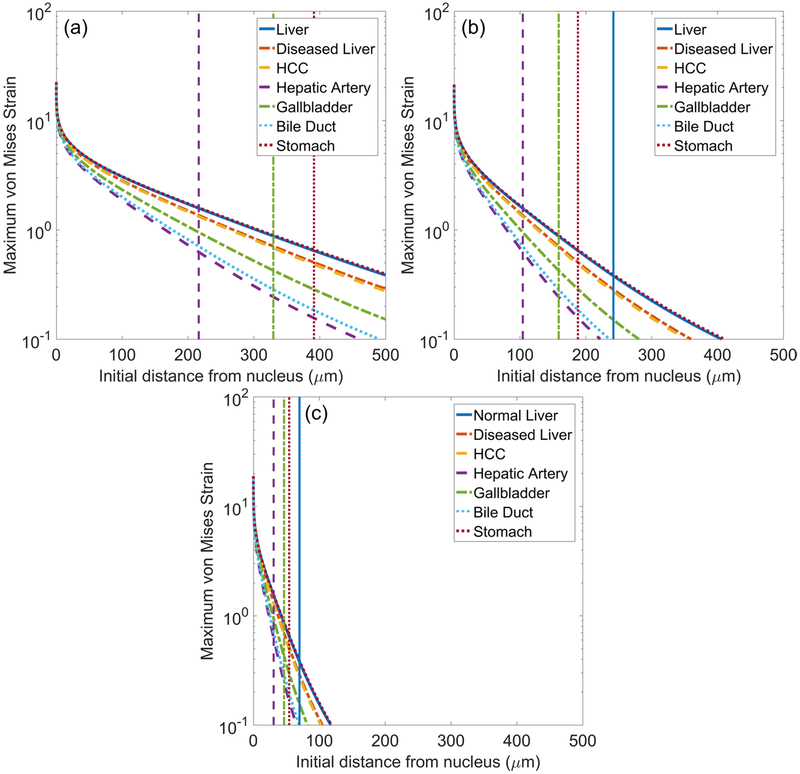
Figure 7.
Maximum von Mises strain surrounding bubble as a function of initial distance from the bubble nucleus for different tissues exposed to (a) 0.5 MHz, (b) 1 MHz, and (c) 3 MHz waveforms. Vertical lines indicate the distance at which strain first attenuates below the ultimate true strain of liver, hepatic artery, gallbladder, and stomach.

