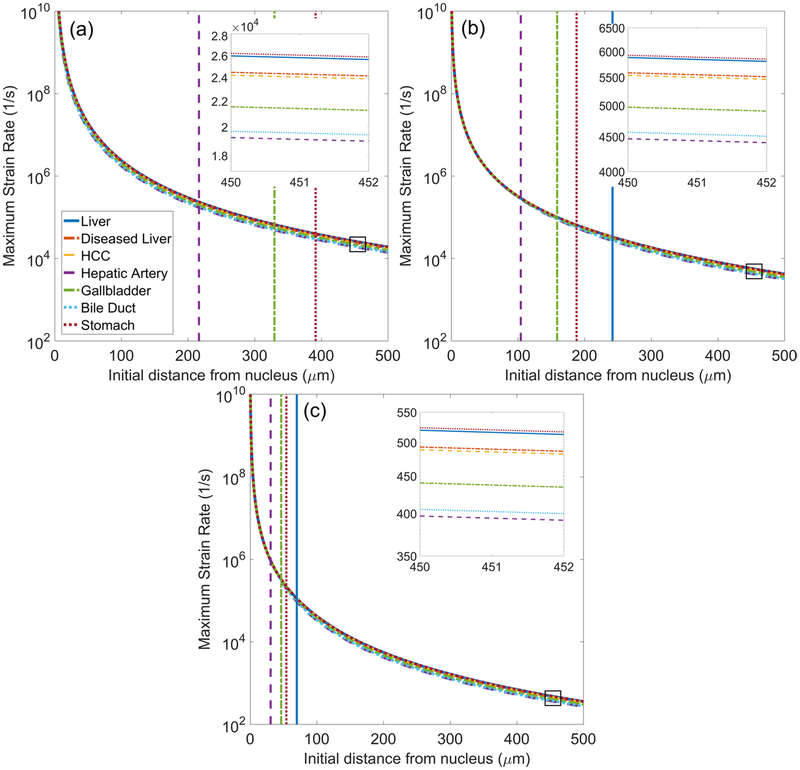
Figure 9.
Maximum von Mises strain rate surrounding bubble as a function of initial distance from the bubble nucleus for different tissues exposed to (a) 0.5 MHz, (b) 1 MHz, and (c) 3 MHz waveforms. Inset figures show enlargement of strain rate traces in the boxed region. Vertical lines indicate the distance at which strain first attenuates below the ultimate true strain of liver, hepatic artery, gallbladder, and stomach.

