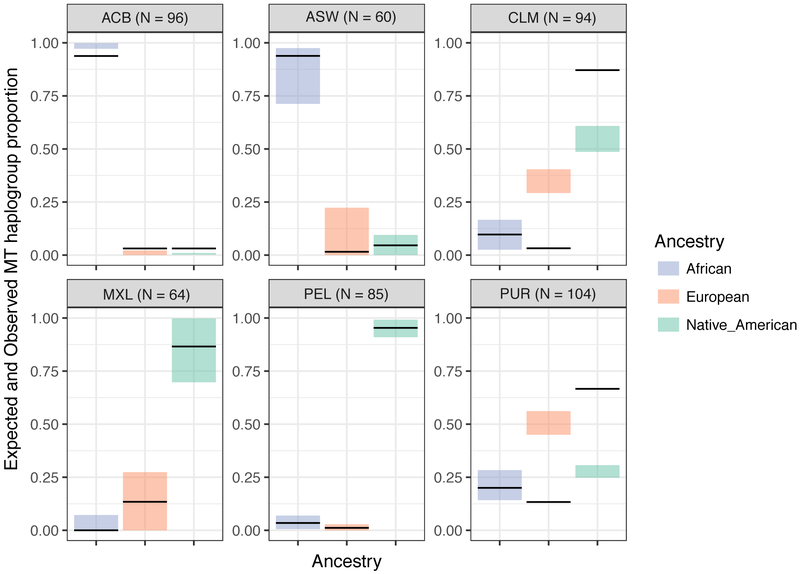
Figure 4. Expected vs. observed frequency of mtDNA haplogroups from each of the three source populations.
The colored boxes show the 95% bootstrap interval of the expected mtDNA haplogroup frequency based on the proportion of ancestral females estimated from the ancestry proportions on the X- chromosome and autosomes (Fig. 5). The black horizontal lines show the observed frequency of mtDNA haplogroup. While in most cases the observed mtDNA haplogroup frequency falls within range of expectations, in some cases (in CLM and PUR), the observed frequencies greatly deviate from expectation. ACB: African Caribbeans from Barbados; ASW: African Americans from South Western USA; CLM: Colombians from Colombia; MXL: Mexicans from Los Angeles, USA; PEL: Peruvians from Lima, Peru; PUR: Puerto Ricans from Puerto Rico.

