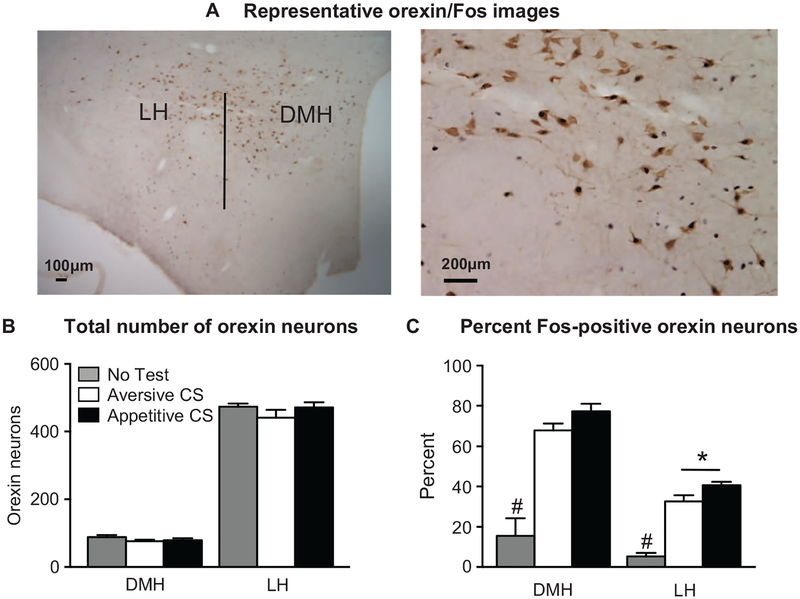
Figure 5.
Fos expression in orexin neurons during cue-induced food seeking after punishment. (A) Photomicrograph representing the hypothalamic subregions, including the lateral hypothalamus (LH) and dorsomedial hypothalamus (DMH) as well as a representative image of our Fos-orexin double-label immunohistochemistry. (B) There was no significant difference in the total number of orexin-positive cells across test cue groups in either the LH or DMH. In the LH, rats tested with the appetitive conditioned stimulus (CS) had a significantly greater percentage of Fos-positive orexin cells compared to those tested with the aversive CS. (C) In both LH and DMH, the no-test group had significantly lower percentages of Fos-positive orexin cells compared to rats tested with either the appetitive or aversive CS. * p < .001, #p < .001, no-test group significantly different from both the appetitive and aversive CS groups. Appetitive CS group, n = 9; aversive CS group, n = 8; no-test group, n = 4.

