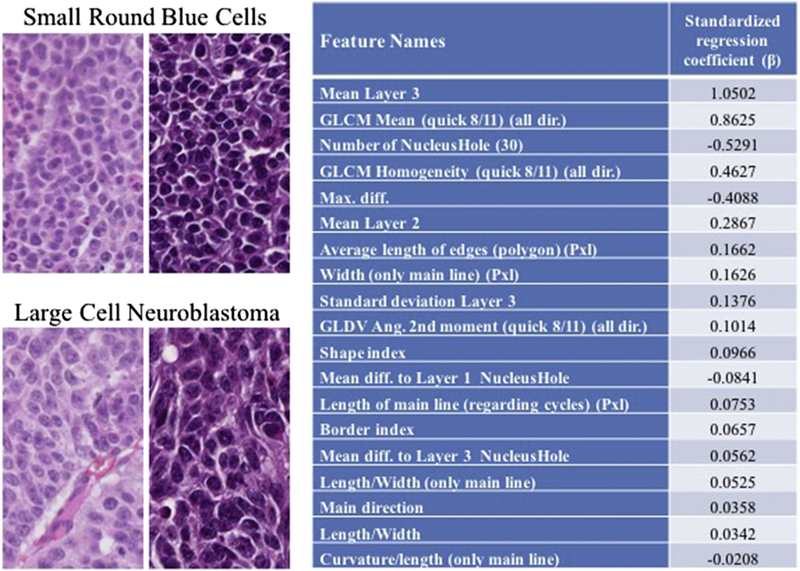
Figure 3.

Representative sections of clusters of small round blue cells typical of neuroblastoma and LCN seen after high-dose intra-tumoral chemotherapy. Features of the 19-variable prediction model and associated regression coefficient (ß). Key features in the model reflect differences in color, texture, size, and nuclear shape. GLDV, Gray Level Difference Vector.
