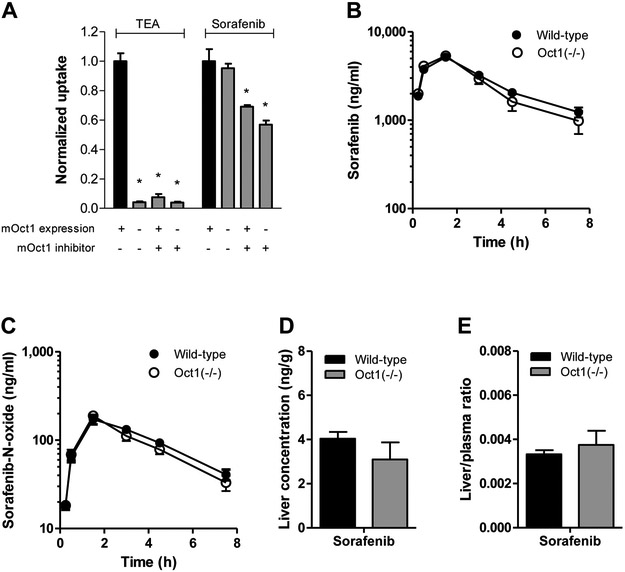
Figure 2.
Evaluation of transport of sorafenib by mouse OCT1 (mOCT1) in vitro and in vivo. (A) Comparison between uptake of the mOCT1 probe substrate TEA (100 μM) and sorafenib (0.2 μM) into HEK293 cells expressing an empty pcDNA3 vector (VC) or mouse OCT1 in the presence or absence of the OCT1 inhibitor decynium22 (5 μM) after 10-min incubations. Data are presented as mean (bars) and SD (error bars) of 6 observations. The star (*) represents statistical significance (P<0.05) vs cells expressing OCT1 in the absence of decynium22. (B-D) Influence of OCT1-deficiency on the plasma pharmacokinetics of sorafenib (B) and its metabolite sorafenib-N-oxide (C). Corresponding liver levels (D) and liver-to-plasma ratios (E) are shown for sorafenib at the end of the experimental sampling period (7.5 h) are presented as mean (bars) and SE (error bars) of 9 observations. All animals received sorafenib as a single oral dose of 10 mg/kg.

