Figure 6.
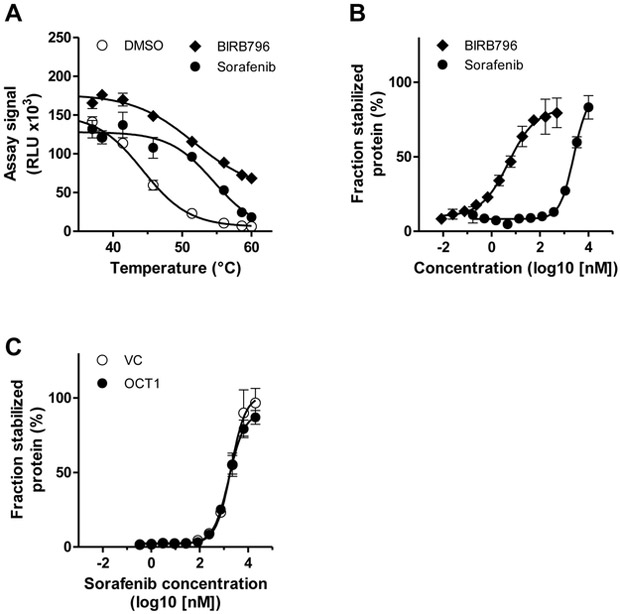
Cellular thermal shift assays with intact HEK293 cells. (A) Melting curves of p38α-ePL measured after 60 min of incubation of cells with DMSO (1%), the positive control inhibitor BIRB796 (5 nM) or sorafenib (5 μM). Data are presented as mean (symbols) and SD (error bars) of 2 determinations. (B) Isothermal inhibitor dose-response curves at 51.4 °C after incubation of cells expressing p38α-ePL for 60 min with BIRB796 and sorafenib. Data are presented as mean (symbols) and SD (error bars) of 2 determinations. (C) Isothermal inhibitor dose-response curves at 51.4 °C after incubation of HEK-VC and HEK-OCT1 cells expressing p38α-ePL with sorafenib for 10 min. Data are presented as mean (symbols) and SD (error bars) of 6 determinations. RLU, relative light units.

