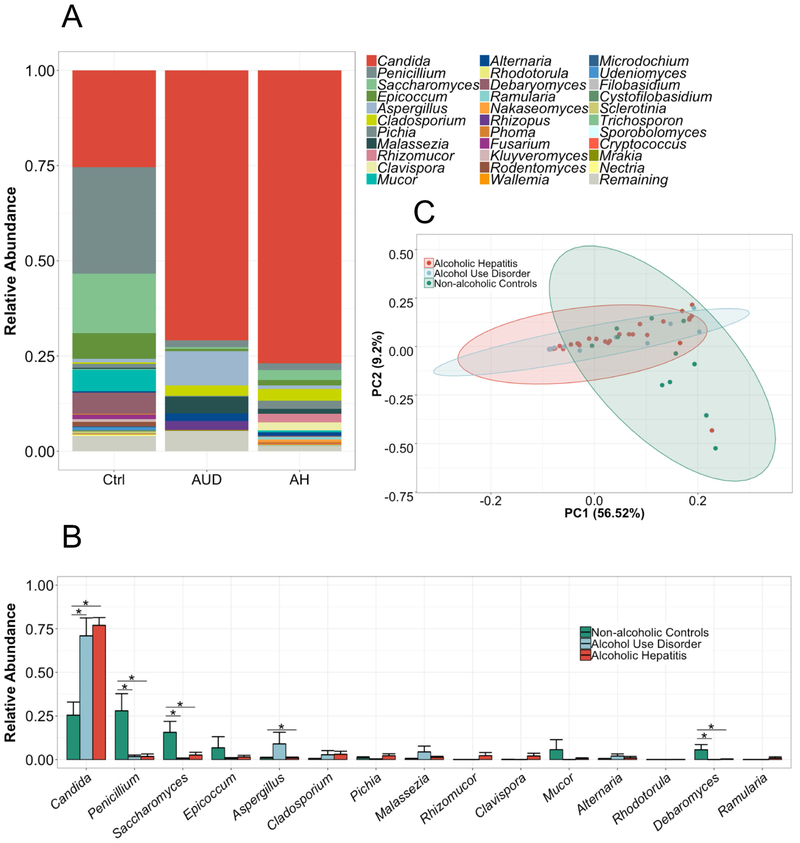
Figure 2. The fungal composition is altered in patients with alcohol-associated liver disease.
ITS sequencing of fecal samples from 11 non-alcoholic controls, 15 patients with alcohol use disorder and 59 alcoholic hepatitis patients. (A-B) The graphs demonstrate the mean relative abundance of sequence reads in each genus for each group. 0-1 corresponds to 0-100% abundance. A total of 81 different genera were detected. Shown are only genera that cover in total at least 95% abundance of all genera. In (B), the standard error of the mean is shown as error bar. *p<0.05, Kruskal-Wallis test for nonparametric data and Dunn post-hoc test. (C) Principal component analysis (PC) was used to show ß-diversity between the groups based on the abundance of 81 fungi at the genus level. The axes represent the two most discriminating axes using the euclidean distance metric. 56.5% of the variances are explained by PC1 and 9.2% by PC2. Ctrl, non-alcoholic controls; AUD, alcohol use disorder, AH, alcoholic hepatitis.

