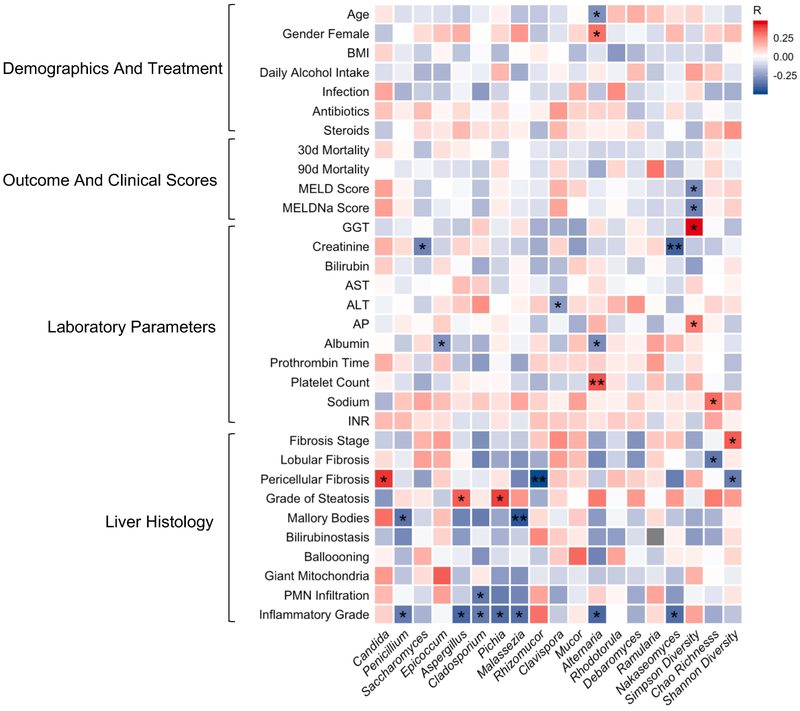
Figure 3. Intestinal fungi correlate with clinical parameters in alcoholic hepatitis.
Heat map representing color-coded spearman’s correlations of clinical parameters. Red color indicates positive- and blue color negative correlation. All variables are coded from low to high- i.e. red color in antibiotics means antibiotic use is positively correlated with the respective fungi. *p<0.05 p>0.01, **p<0.01 p>0.001. Fibrosis stage, 0 no fibrosis, 1 portal fibrosis, 2 expansive periportal fibrosis, 3 bridging fibrosis, 4 cirrhosis. Lobular fibrosis, 0 no fibrosis, 1 zone 3 (centrilobular) fibrosis, 2 zone 2+3 (midzonal) fibrosis, 3 panlobular fibrosis. Pericellular fibrosis, 0 absent, 1 present. Steatosis, 1 mild < 33%, 2 moderate < 33–66%, 3 marked > 66%. Mallory bodies, 0 absent, 1 present. Bilirubinostasis, 0 no, 1 hepato-canalicular, 2 cholangiolar, 3 both. Ballooning, 0 occasional hepatocellular, 1 marked hepatocellular, 2 none present. Megamitochondria, 0 absent, 1 present. PMN infiltration, 0 no, 1 mild, 2 severe. Inflammation, 0 no, 1 mild, 2 severe. PMN, polymorphonuclear infiltration; INR, international normalized ratio; ALT, alanine aminotransferase; AST, aspartate aminotransferase; GGT, gamma-glutamyl-transferase; AP, alkaline phosphatase; BMI, body mass index. MELD, Model for End-stage Liver Disease, MELDNa, Sodium Model for End-stage Liver Disease.

