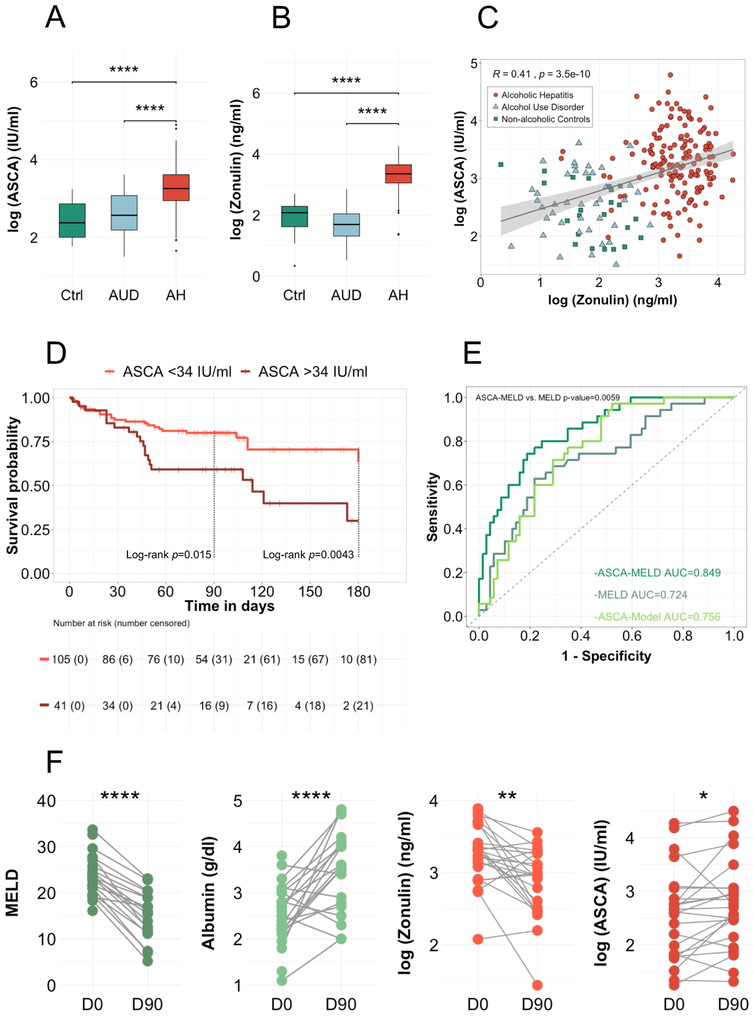
Figure 4. ASCA are increased in alcoholic hepatitis and associated with increased mortality.
(A) Logarithmic ASCA levels were compared in 23 non-alcoholic controls, 40 patients with alcohol use disorder and 163 alcoholic hepatitis patients. Kruskal-Wallis test for nonparametric data and Dunn post-hoc test. *p<0.05 p>0.01, **p<0.01 p>0.001, ****p<0.001. (B) Logarithmic zonulin levels were compared and correlated (Spearman’s correlation) with ASCA levels (C) in 23 non-alcoholic controls, 40 patients with alcohol use disorder and 156 alcoholic hepatitis patients. (D) Kaplan-Meier curve of 180-day mortality for patients with alcoholic hepatitis. Patients were grouped according to their serum levels of ASCA. Patients that were lost to follow-up were censored at the time they were last seen alive. The number of patients at risk is indicated as well as the number of censored patients in brackets. At day-180, all remaining patients were censored, even though they had a longer survival, resulting in the high number of censored patients. (E) Receiver operating curves with area under the curve and Delong’s p value for the comparison of ASCA-MELD and MELD-score. (F) Longitudinal analysis of clinical parameter and serum marker of 24 alcoholic hepatitis patients. Measurement at day zero (D0, after admission) and around ninety-day follow-up visit (D90, follow-up measurement around ninety days after day zero, 18 of the 24 samples were collected at day-90, 6 had a longer follow up (between 90 and 154 days)). Paired t-test. Ctrl, non-alcoholic controls; AUD, alcohol use disorder; AH, alcoholic hepatitis. MELD; ASCA, anti–Saccharomyces cerevisiae antibodies; Model for End-stage Liver Disease.

