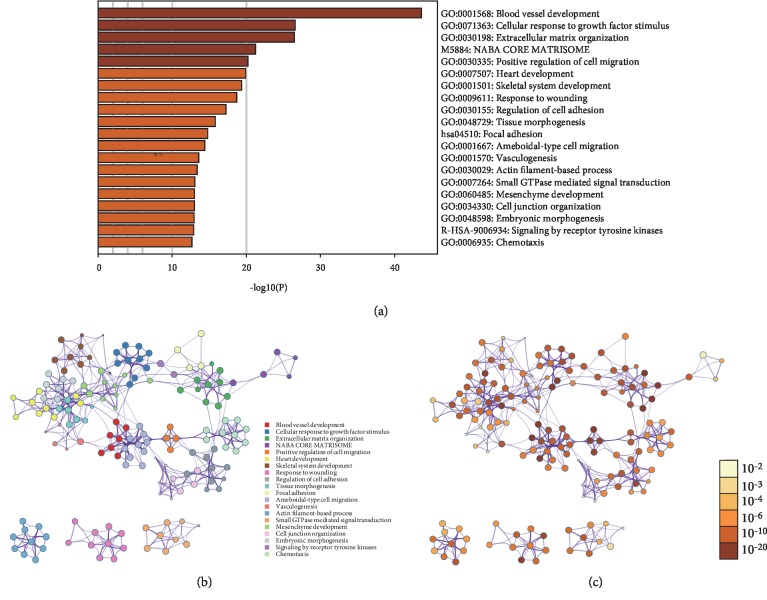
Figure 3.
GO and PPI analysis of IGFBP5 related genes. (a) Main GO biological processes for IGFBP5 and its related genes analyzed by Metascape analysis tools. (b) The PPI networks determined by function cluster analysis. Different color represents for different function cluster. (c) The PPI networks determined by function cluster analysis. Different color represents for different P value. GO=gene oncology. PPI = protein-protein interaction.

