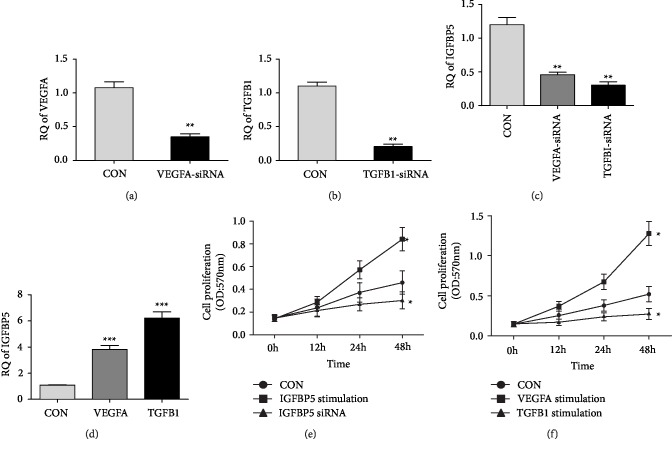
Figure 5.
Expression of IGFBP5 in Caki-2 cell line. (a) Expression of VEGFA after inhibited by siRNA (n = 3). The fold change is 3.1 (P < 0.01). (b) Expression of TGF-β after inhibited by siRNA (n = 3). The fold change is 5.4 (P < 0.01). (c) Expression of IGFBP5 after VEGFA and TGF-β blocked by siRNA (n = 3). IGFBP5 was downregulated by 2.6-fold and 4.0 fold respectively (P < 0.01). (d) Expression of IGFBP5 after stimulated by VEGF165 and TGF-β (n = 3). IGFBP5 was upregulated by 2.8-fold and 6.2-fold respectively (P < 0.01). (e) Cell proliferation rate of Caki-2 detected by MTT assay (n = 3). The proliferation rate of IGFBP5 stimulation group is higher than normal control group (P < 0.05), and cell proliferation of IGFBP5 knockdown group is lower than normal control group (P < 0.05). (f) Cell proliferation rate of Caki-2 detected by MTT assay (n = 3). The proliferation rate of VEGF165 stimulation group is higher than normal control group (P < 0.05), and cell proliferation of TGF-β stimulation group is lower than normal control group (P < 0.05). (n = 3) (∗, p < 0.05;∗∗, p < 0.01;∗∗∗, p < 0.001).

